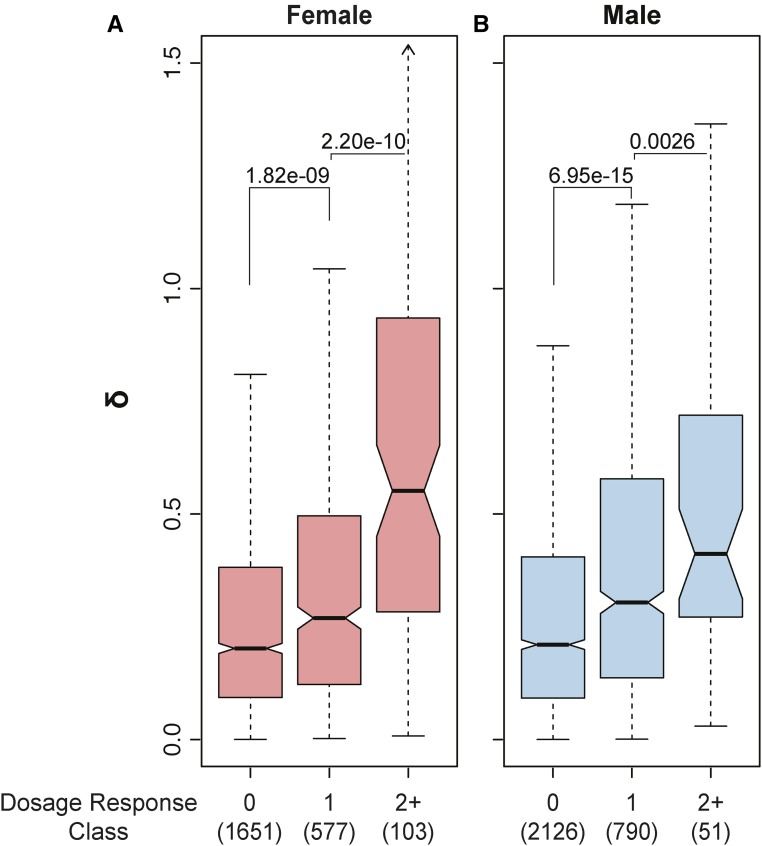
Figure 4.
Gene dosage response vs. expression variation. Boxplots of expression variability as a function of gene dosage response in female (A) and male (B) flies. Dosage response is defined as | log2(FC + 1) |, where FC is fold change (Df/+ vs. control) rounded to the closest integer (see Materials and Methods). Numbers in parentheses indicate the number of genes in each bin. Data from the 99 DrosDel set are used here.

