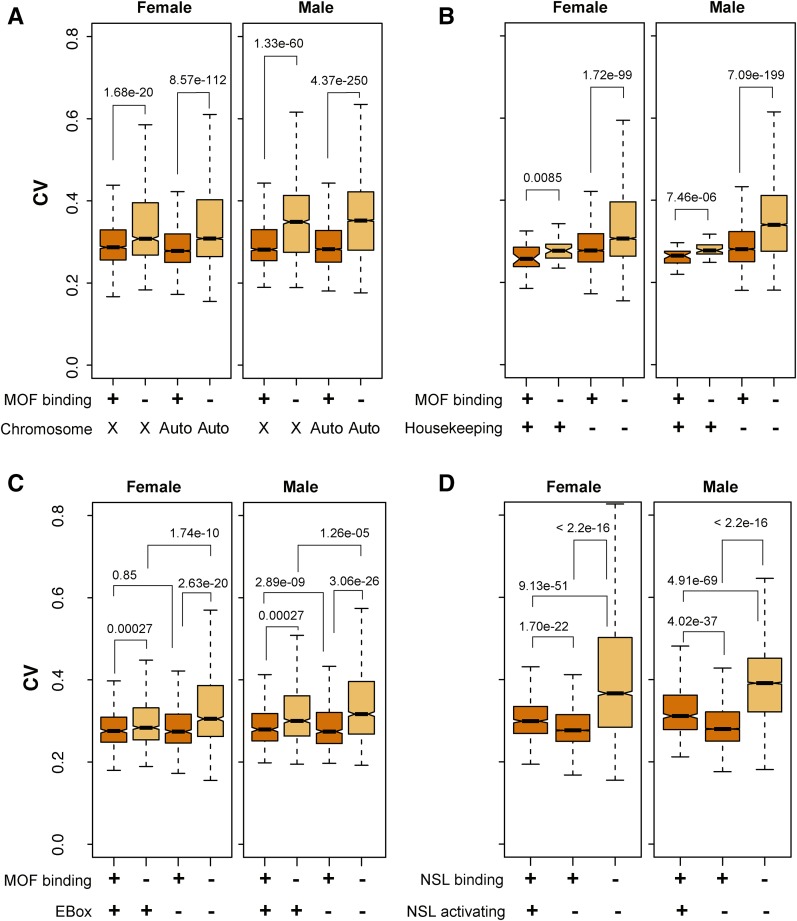
Figure 6.
Expression variation and MOF histone acetyltransferase occupancy and activity. Boxplots display expression variation of genes enriched (+, orange) or nonenriched (−, light orange) for MOF or NSL occupancy. Expression variability was assessed by CV. Genes from chromosome 2L (where the Dfs reside) were excluded. (A) Binning by MOF occupancy and X-linked (X) vs. autosomal (auto) genes. (B) Binning by MOF binding and housekeeping vs. nonhousekeeping autosomal genes. We identified housekeeping genes based on tissue specificity defined by tau (Yanai et al. 2005). (C) Binning by MOF binding, and presence (+) or absence (−) of an EBox motif (CAGCTSWW) at the promoter. (D) Binning by NSL1 binding and positive (+) or absent (−) transcriptional responses (“activating”) to NSL1+. MOF or NSL occupancy is indicated in all plots (+, orange; −, light orange). Expression data from the 99 DrosDel lines dataset are used here.

