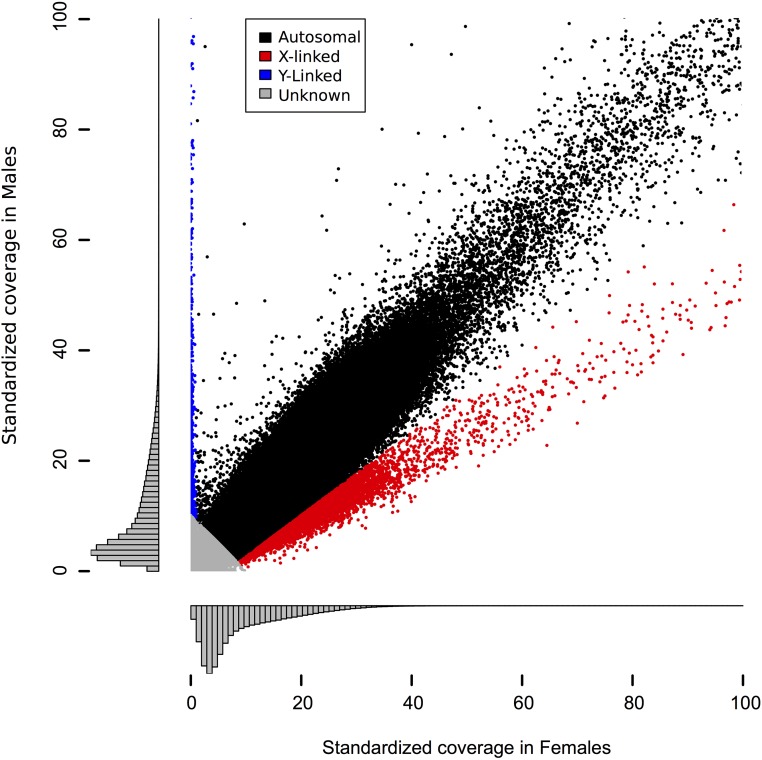
Figure 1.
Relative coverage in females and males can be used to identify sex chromosomes. Plotted here is standardized coverage in females against standardized coverage in males; histograms show the density of markers along each axis. The markers shown are those with low overall coverage; a long tail exists in both females and males and is not shown here. Markers with <10× total standardized coverage were annotated as unknown (gray) because those have too little coverage to reliably distinguish X- and Y-linkage from autosomes. Of the remaining tags, those with <1× standardized coverage in females are annotated as Y-linked (blue). Those that satisfy the inequality: coveragemale < 3/4 coveragefemale − 5 were identified as X-linked (red). This line has a slope designed to discriminate points in the X-linked cluster (slope = 1/2) from those in the autosomal cluster (slope = 1) while remaining fairly conservative near the origin. All remaining tags were annotated as autosomal (black).

