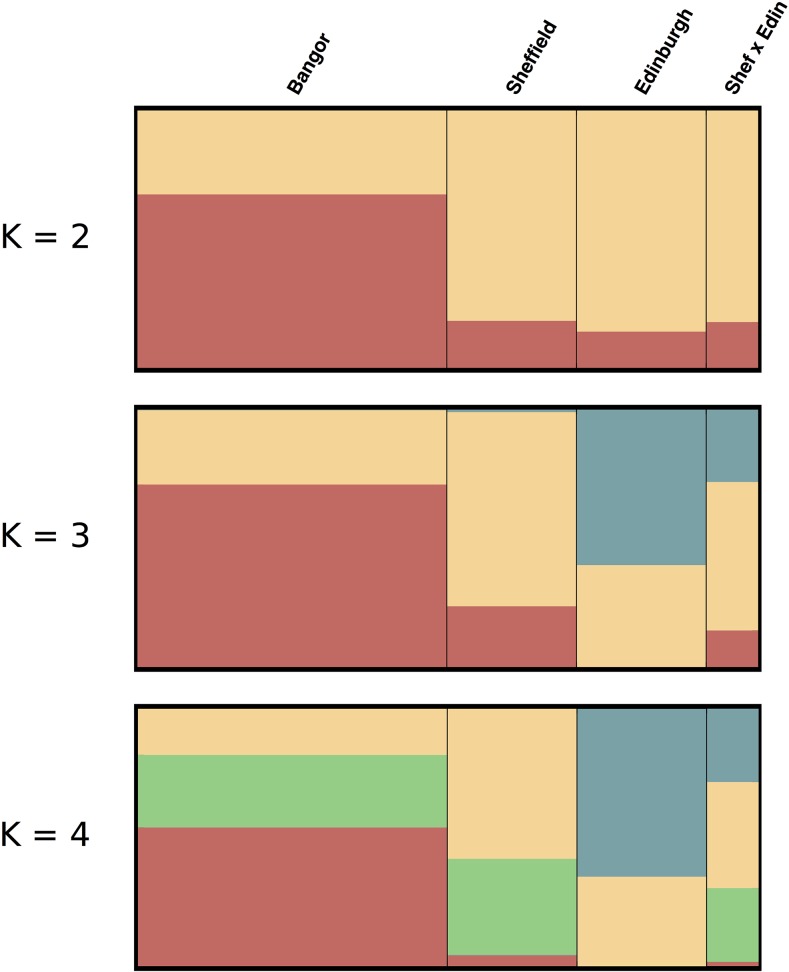
Figure 3.
Structure plots of gerbil colonies. Structure was run for 20,000 iterations with 10,000 iterations of burn-in for K = 2, 3, and 4. In general, the different colonies have similar assignment especially at low K values. Edinburgh animals fall out uniquely at higher K values (i.e., blue). The F1 hybrids have mixed ancestry as expected for the offspring of a Sheffield × Edinburgh cross.

