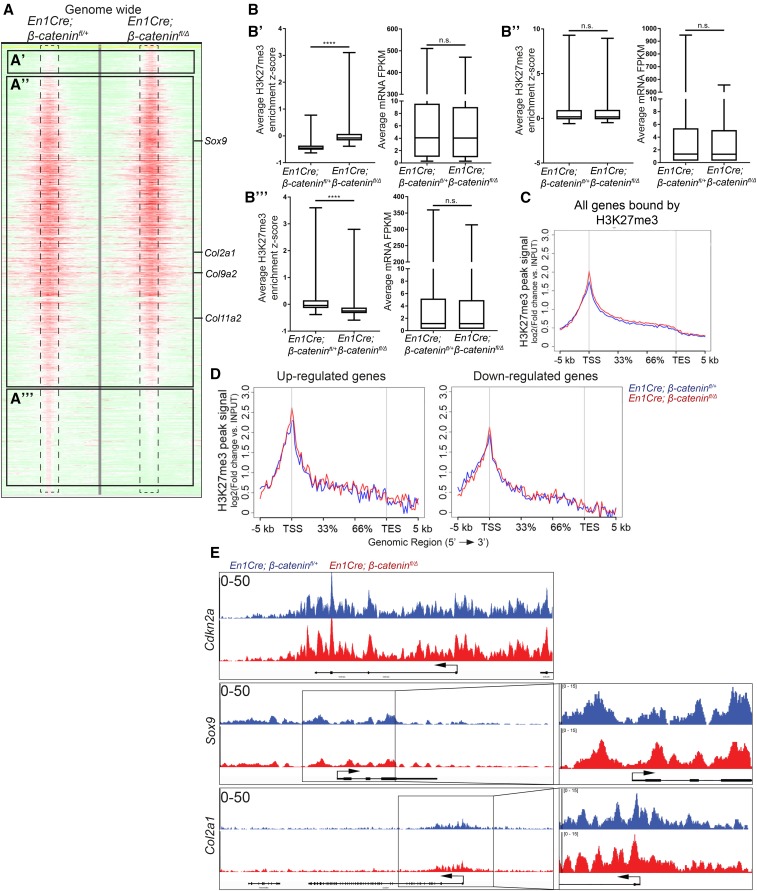
Figure 5.
Loss of β-catenin does not significantly alter H3K27me3 enrichment genome-wide or on cartilage differentiation determinants. (A) Treeview representation of H3K27me3 peak strength genome-wide in the CM+ectoderm between E13.5 En1Cre/+;R26R/+;β-cateninfl/+ controls and En1Cre/+;R26R/+;β-cateninfl/∆ mutants. H3K27me3 ChIP-sequencing signal strength was mapped 5 kb up- and downstream from each peak. A change from high intensity to low intensity identifies a peak is lost. (B) Intersection of changes in H3K27me3 enrichment from (A), with En1Cre/+;R26R/+;β-cateninfl/∆ mutant and En1Cre/+;R26R/+;β-cateninfl/+ control RNA-seq (B’–B’’’) corresponding with (A’–A’’’), respectively. (C and D) Intersection of En1Cre/+;R26R/+;β-cateninfl/+ control and En1Cre/+;R26R/+;β-cateninfl/∆ mutant ChIP-sequencing and RNA-seq. H3K27me3 ChIP-sequencing signal strength was measured across all genes bound by H3K27me3 or genes identified to be differentially expressed in β-catenin mutant CM+ectoderm. The x-axis demarcates the percent distance across a gene between the TSS and the TES. (E) IGV representation of H3K27me3 signal peaks between En1Cre/+;R26R/+;β-cateninfl/+ control (n = 1) and En1Cre/+;R26R/+;β-cateninfl/∆ mutant (n = 1) CM+ectoderm. Cdkn2a is a known target of PRC2. Sox9 and Col2a1 are chondrocyte marker genes. ChIP, chromatin immunoprecipitation; CM, cranial mesenchyme; FPKM, fragments per kilobase of transcript per million mapped reads; n.s., not significant; RNA-seq, RNA-sequencing; TES, transcription end site; TSS, transcription start site.

