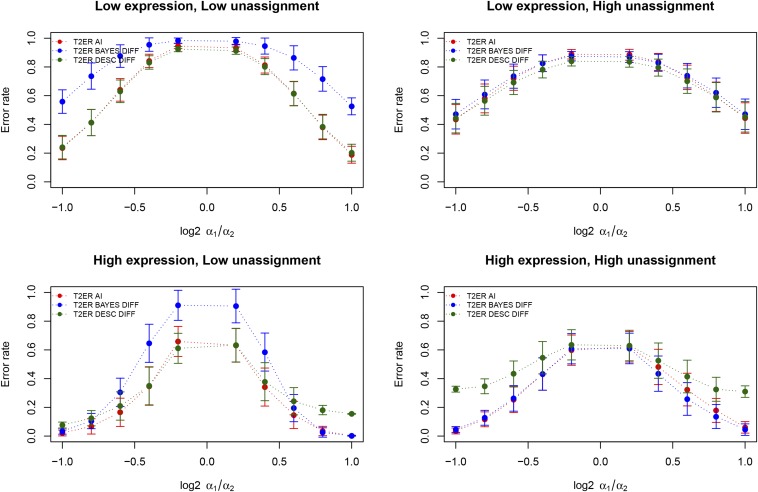
Figure 3.
Type II error rate. Type II error rate when comparing an environment for which no AI was present (α1 = 1) with an environment with varying levels of AI. Differences in AI between environments are reported as log2 α1/α2. The two upper panels show Type II error rate in case of low gene expression, and the two bottom panels show Type II error rate in case of high gene expression. Panels on the left show results obtained by specifying the number of reads aligning equally well to both alleles as expected under the model in Table 1. Panels on the right shows results obtained by multiplying that quantity by 10,000. We plot in red the type II error rate in environment 1, in blue the type II error rate for difference in AI between environments, and in green the type II error rate between the environments when using the descriptive approach as implemented in the baseline model. Each point represents the average over the seven simulated levels of bias misspecification, and the error bars represent SE. Low expression: η = 10; High Expression: η = 100; Low unassignment: unassigned reads = zi,k; High unassignment: unassigned reads = 10,000 × zi,k

