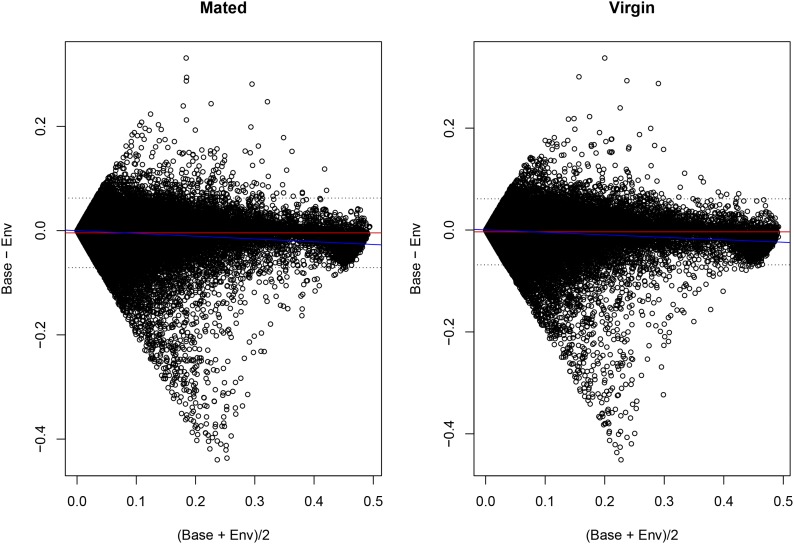
Figure 7.
BA plot. BA plot comparing estimates of ϑ according to the baseline (Base) and environmental (Env) model in mated and virgin flies, respectively. The red line represents the mean difference. The dotted lines are the 95% confidence intervals of the difference. The regression of the difference over the mean is represented by the blue line.

