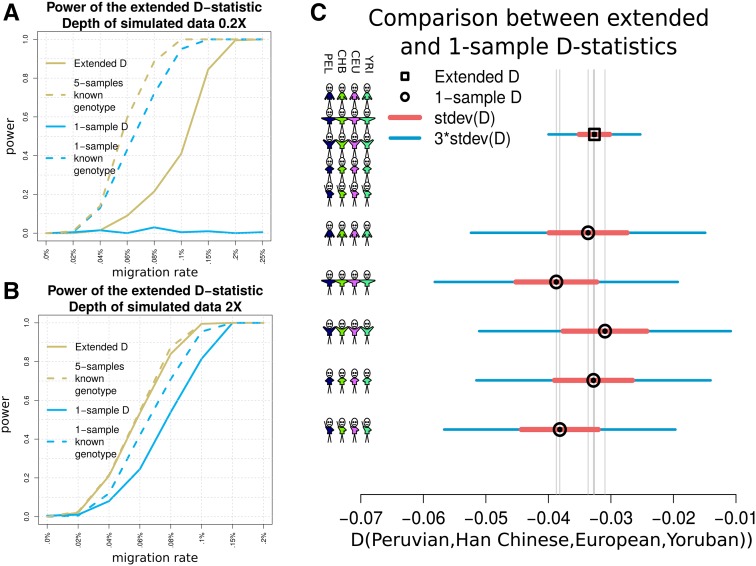
Figure 4.
Detection of admixture and migration. (A and B) Rejection rate of the null hypothesis as a function of the migration rate in the tree where a migration from to occurs. The yellow and blue solid lines represent, respectively, the power of the method related to and The yellow dashed line represents the rejection rate when the genotypes of the five individuals in each population are known and thus equation (3) can be applied. The blue dashed line illustrates the power of the method when only one genome per population has known genotypes. performs almost as well as knowing the true genotypes already with depth 2×. (C) Value of lack square) and values of (black circles) using, respectively, five genomes per population and one from each population. Each D-statistic shows its associated SD multiplied by 1 and 3. On the left side of the graph, the stick men represent for each column the composition of the group by number of individuals.

