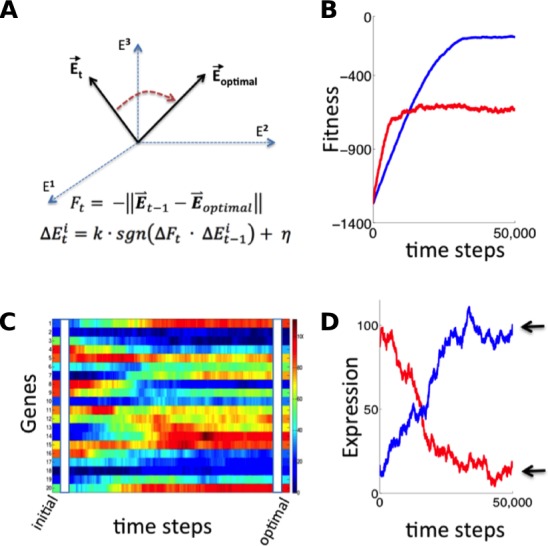
Figure 2. Simulation of fitness-directed stochastic tuning for a thousand-gene system.

(A) Quantitative framework describing stochastic tuning. The transcriptional activity state of the genome is represented by the vector E, here schematically represented for a three-gene system. In any environment, there is an optimal transcriptional state vector (Eoptimal) that yields maximum fitness. At any time (t), a cell with transcriptional activity state Et has global health/fitness (Ft) defined as the negative of the Euclidean distance between the immediately preceding transcriptional activity state Et-1 and Eoptimal. Each gene promoter (i) executes a change in transcriptional activity ∆Eit which has two components: (1) a step with magnitude of k and sign (sgn) matching that of the product of the global change in fitness (∆Ft) experienced at time t and the preceding change in transcriptional activity ∆Eit-1, and (2) a noise component with a magnitude of η and a random sign (+/-). (B) The stochastic tuning process moves the transcriptional activity state towards the optimum, resulting in increasing health/fitness over time. Simulated trajectories are shown for a 1,000-gene system with k = 0.1, η = 0.1 (blue); k = 0.5, η = 0.5 (red). (C) The time evolution of the transcriptional activity state vector as a system containing 1000 genes converges to optimal transcriptional activities through stochastic tuning. The temporal profiles of 20 representative genes are shown, starting from randomly assigned initial activities, and gradually converging to activities that are near optimal for fitness (using parameters corresponding to the blue curve in panel B). (D) Trajectories of two representative genes are shown for the same simulation as in panel C). Transcriptional activities start at randomly assigned initial values and gradually converge to near the optimum (arrows).
