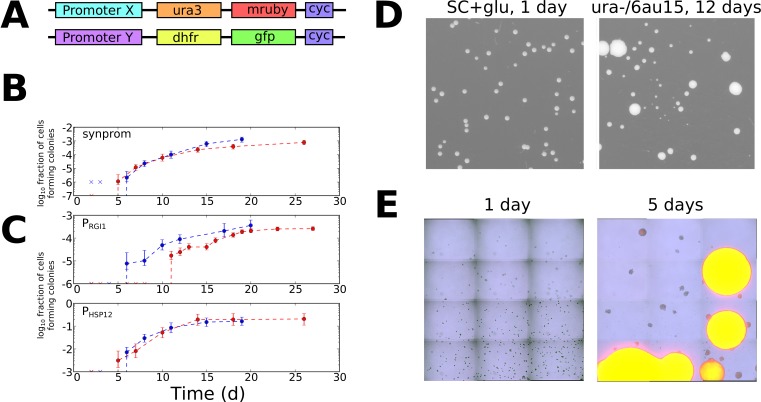
Figure 3. Stochastic tuning of yeast cells under uracil starvation.
(A) Schematic of the constructs used in this study. All strains are diploid, containing similar insertions at the LEU2 locus of both copies of chromosome III. X is either a synthetic promoter (synprom) or a natural promoter (PRGI1 or PHSP12) unless otherwise noted, and Y is either the same promoter as X or is the strong constitutive promoter PADH1. ‘cyc’ indicates the well-characterized CYC1 transcriptional terminator (Russo and Sherman, 1989). (B) Stochastic colony formation on ura-/6AU15 plates for cells containing URA3-mRuby under control of synprom and DHFR-GFP under control of PADH1. Error bars show central 95% credible intervals; colors show biological replicates performed on different days. ‘x’ marks are shown at the bottom of the axis for days where zero visible colonies were present at all plated dilutions. Cells plated on SC+glu uniformly form visible colonies within 1–2 days. (C) As in panel B, but with URA3-mRuby controlled by PRGI1 or PHSP12 as indicated. (D) Images of colony growth on SC+glu and ura-/6AU15 plates taken at the specified number of days after plating (1 day for SC+glu, 12 days for ura-/6AU15). Growth of colonies is nearly uniform on SC+glu plates but shows non-uniform stochastic emergence on ura-/6AU15. N.b. the plated dilutions for the two plate types are not the same. URA3 expression for the experiment shown is controlled by PHSP12, but similar behavior was observed for all promoters discussed here. (E) Early colony formation on ura-/6AU15 plates imaged by superimposed differential interference contrast and fluorescence microscopy. Cells contain PHSP12-URA3-mRuby/PADH1-DHFR-GFP. Left panel: One day after plating. By this timepoint small, macroscopic colonies would have formed on SC+glu plates, but instead cells remain in microcolonies having undergone no more than three doublings. Right panel: Same plate as left, five days after plating. While most cells have not grown since the one-day timepoint, other cells having undergone successful tuning instead form larger colonies with URA3 expression sustained throughout them.
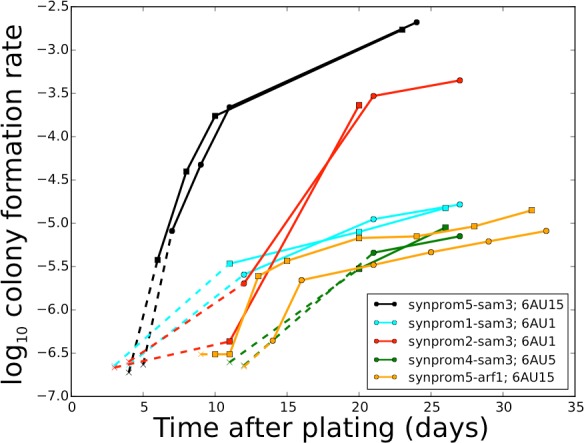
Figure 3—figure supplement 1. Stochastic colony formation rates for cells with URA3 driven by a variety of synthetic promoters.


