. 2018 Apr 5;7:e31867. doi: 10.7554/eLife.31867

Figure 4. Tuning is both promoter- and allele-specific.

(A) Cell counts for synprom-URA3-mRuby/PADH1-DHFR-GFP cells in liquid ura-/6AU5 media. Colors correspond to different biological replicates started on different days. Arrows indicate two timepoints from each strain for which fluorescence cumulative distribution functions (CDFs) are shown below. Error bars for cell counts show central 95% credible intervals. (B) Flow cytometry cumulative distributions of fluorescence levels for URA3-mRuby and DHFR-GFP during uracil starvation. In each CDF a given timepoint (solid line) is compared to the distribution present for cells in logarithmic growth in SC+glu (rich) media (dashed lines). The values shown are log2 ratios to the median value of cells growing exponentially in SC+glu. GFP signals are shown in green and mRuby signals in red. (C) Analogous to A, but we consider cells where synprom drives both URA3-mRuby and DHFR-GFP. (D) Analogous to B, but for cells with synprom driving both URA3-mRuby and DHFR-GFP.
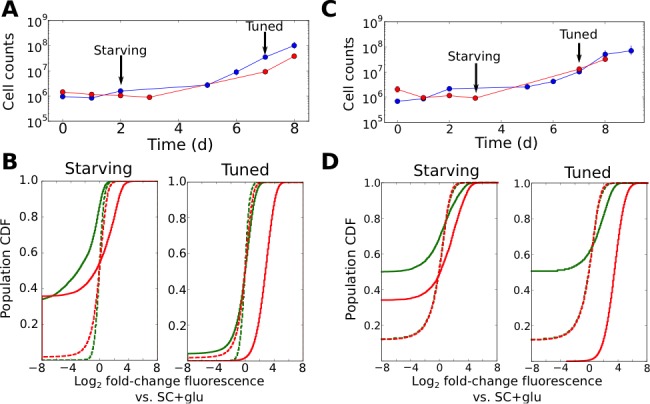
Figure 4.

Figure 4—figure supplement 1. Promoter-specific stochastic tuning of URA3 expression by native promoters in S. cerevisiae.
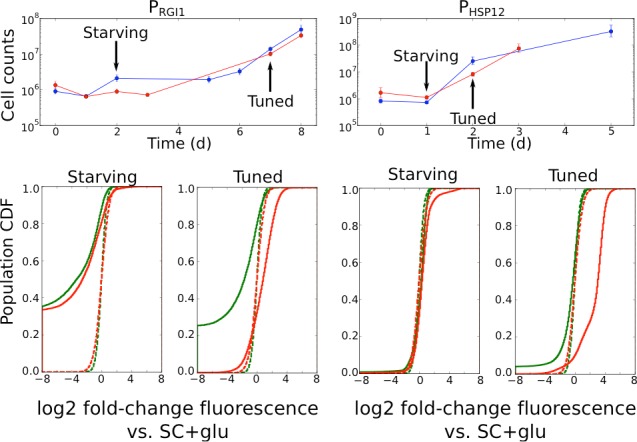
Figure 4—figure supplement 1.

Flow cytometry data on counts and fluorescence distributions for cells containing URA3-mRuby under control of the noted promoter (PRGI1 or PHSP12) and DHFR-GFP under control of PADH1. Cells were grown in liquid ura-/6AU5 media. For the cell counts (top), colors correspond to different biological replicates started on different days. Arrows indicate two timepoints from each strain for which fluorescence cumulative distribution functions (CDFs) are shown below; in each CDF a given time-point (solid line) is compared to the distribution present for cells in logarithmic growth in SC+glu media (dashed lines). The values shown are log2 ratios to the median value of cells growing exponentially in SC+glu. GFP signals are shown in green and mRuby signals in red. Error bars for cell counts show central 95% credible intervals.
Figure 4—figure supplement 2. Local tuning of URA3 expression.
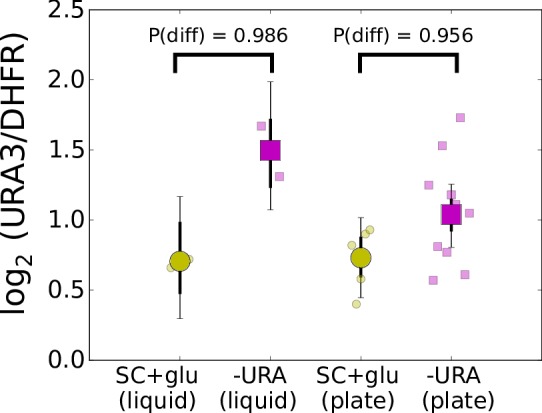
Figure 4—figure supplement 2.

RT-qPCR based quantification of URA3:DHFR ratio for synprom-URA3-mRuby/synprom-DHFR-GFP cells either in in SC+glu media (liquid or plates), from tuned liquid cultures in ura-/6AU5 media, or for tuned colonies on ura-/6AU15 plates. Large points show estimated averages obtained via a Bayesian hierarchical model (see Methods), small points show values for biological replicates, and error bars indicate 75% (strong) or 95% (thin) credible intervals. P(diff) in each case gives the posterior probability that the –URA value is greater than the corresponding SC+glu value. See Supplementary file 7 for primer sequences.