
Figure 7. Heritability of elevated mRuby levels during tuning.
(A) Formation of a microcolony over 24 hr of exposure to ura-/6AU5 media in PHSP12-URA3-mRuby/PADH1-DHFR-GFP cells. GFP and mRuby are shown as transparent green and red overlays. (B) Snapshots equivalent to A) for a non-tuned colony in the same field of view. (C) Observed cumulative distributions (empirical cumulative distribution function; ECDF) of mRuby (left) and GFP (right) levels for cells that either do or do not divide in the timepoint following the measurement (analyzed in four-hour intervals). Values are pooled over all timepoints except the first, for five colonies growing in a single field of view. p-values arise from a Wilcoxon rank sum test applied to the shift between the non-dividing and dividing cells. Δ indicates a point estimate for the difference in fluorescence of the dividing vs. non-dividing cells, along with a 95% confidence interval (95% CI). Values shown are raw fluorescence normalized by the median value for all observations of each fluorescent protein; note the different x scales for mRuby vs. GFP. (D) Lineage traces showing long term propagation/inheritance of URA3-mRuby protein levels. At each specified timepoint, the average fluorescence of each cell is shown on the y axis, with lines connecting each cell to the cell(s) arising from it at the subsequent timepoint; thus, forks in the lines indicate cell division. Colors specify which of five microcolonies a given cell is a part of; only the red microcolony showed notable tuning over the course of the experiment. A black ‘*’ is shown for each transition between adjacent timepoints for which the correlation of ranks between the timepoints in question is significant (p<0.05) using a Spearman correlation test, and a red ‘*’ is shown for transitions where the same criterion holds considering only the rank ordering of cells in the red (tuned) colony (the colony shown in panel A). (E) Observed distribution of mRuby/GFP ratios depending on time elapsed since a lineage of cells began to divide. The x axis divides the cells up by the time (measured in four-hour intervals) that has elapsed since the first observed division event of an ancestor of that cell; ‘Undivided’ indicates cells in lineages that have not yet divided in the analyzed trajectory, and 0 hr denotes cells that will divide before the next analyzed snapshot. Note that points are plotted for each cell at each analyzed frame relative to its own growth history, and thus not all cells at a given x position necessarily arise from the same time point in the image series.

Figure 7—figure supplement 1. Mixing times of mRuby levels for growing (uracil-replete) and uracil-starved cells.
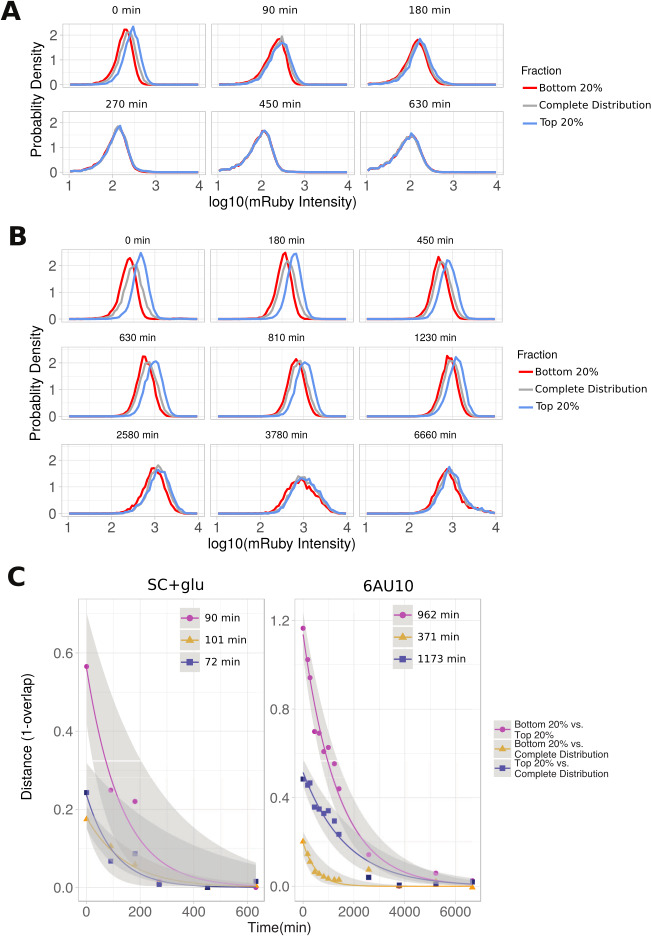
Figure 7—figure supplement 2. Heritability of elevated mRuby levels during early tuning.
