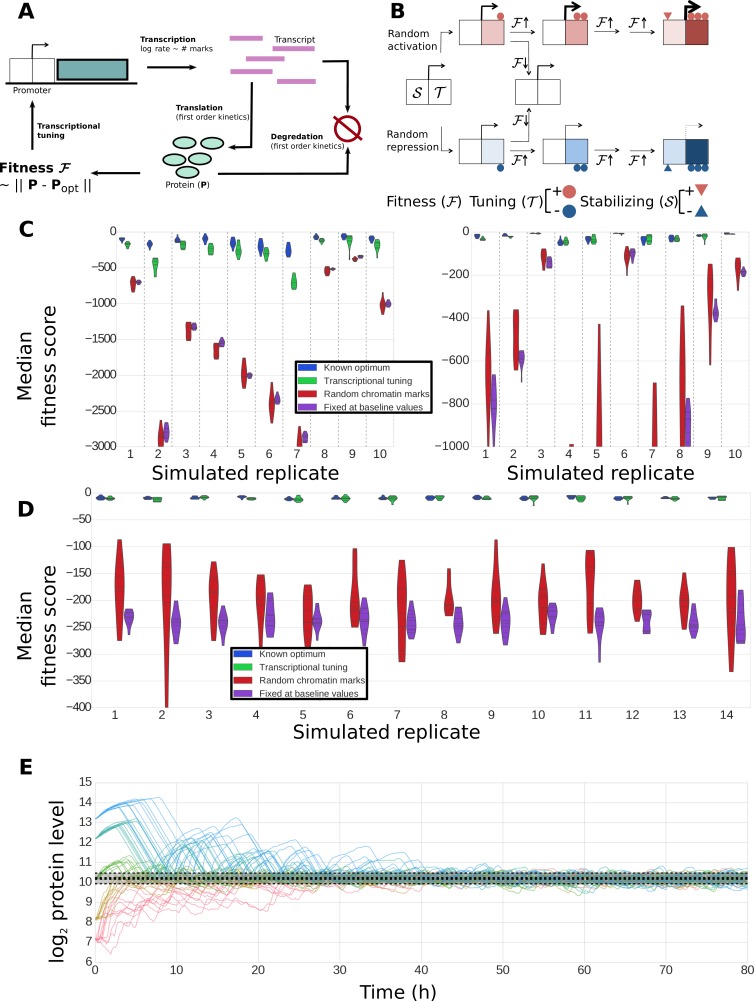
Figure 9. Construction and performance of a biologically feasible model for fitness-directed stochastic tuning.
(A) Schematic of processes modeled in the simulation. Transcripts are produced at a rate dependent upon the state of chromatin marks at each promoter; each transcript has a fixed, gene-dependent probability of being translated at each timestep (producing a protein), and may also be degraded (again, with a gene-dependent probability). Similarly, each copy of a protein may be degraded at each timestep with a protein-dependent probability. The fitness of the system is calculated as the Euclidean distance between the current profile of protein counts present in the cell from a target optimum. Chromatin marks may be added or removed at each promoter at each step, as shown in panel B). (B) Logic underlying changes in tuning and stabilizing mark counts at each step. Tuning marks (T) may be added or removed at each step based on the recent history of changes in fitness, and whether each promoter currently has a net positive (activating) or negative (repressive) T count. Stabilizing marks (S) provide longer term integration by adding activating or repressive marks over time in response to the state of the tuning marks. Thus, if an unmodified promoter undergoes random addition of a positive tuning mark (top path), and that addition proves favorable, it will undergo further addition of positive T marks. If fitness continues to increase, stabilizing marks (S) will be added to stabilize its higher activity. Similar logic holds for the random addition of negative tuning marks (bottom path). In both cases, if the random T-mark perturbation proves unfavorable, the promoter will be modified in the opposite direction, in this case returning it back to its original unmodified state. (C) Distributions of fitness scores for a one-gene system obtained in twenty simulations using different randomly sampled biological parameters (e.g., transcript stabilities, translation rates, etc.) – these different parameter sets are the ‘simulated replicates’ referred to on the x axis. The median scores over the last quarter of the simulation are shown for 10 independent tuning trajectories (differing in their random number seeds). Each simulation proceeded for 300,000 steps (83.3 hr of simulated time). Different colors indicate varying methods used to control transcription rates (as shown in the legend): ‘Known optimum’ refers to a case where transcription rates are kept fixed at their predefined target values, ‘Stochastic tuning’ is the full model described in the Methods section, ‘Random chromatin marks’ is equivalent to the tuning model except that the direction of T chromatin mark addition is random instead of fitness directed, and ‘Fixed at baseline values’ shows the case where transcription rates are fixed at their initial values (intended to correspond to the environment that the cells were in prior to the onset of stress exposure). Dashed vertical lines group simulations performed with identical parameters. On the left axis we show ten sets of simulations where the target transcription rate was eight-fold higher than the starting rate, and on the right axis simulations where the target transcription rate was eight-fold lower than the starting rate. (D) Robustness of tuning against changing model parameters. Violin plots are defined as in panel C), but in this case show the distributions of fitness scores observed under variations of the model parameters (e.g., magnitude of individual tuning and stabilizing marks) for a single, randomly chosen set of gene-specific parameters. Plotted are the median fitness scores over the last quarter of each simulation, using either our central ‘baseline’ parameters for all model parameters (leftmost replicate; see Supplementary file 8), or twofold changes (up or down) of each editable parameter in our model. (E) Tuning performance of a single gene matching a wide range of biological challenges. For a fixed set of biological parameters (see Materials and Methods), we performed 10 simulations each where the initial transcription rates were off from the target rate by a factor of 23, 22, 0, 2−2, and 2−3, running in order from blue to red. A strong dashed black line shows the median obtained from the last quarter of a long (3 million step) simulation with transcription rates fixed at their optimal values; the shaded region shows the extent of a region encompassing 95% of the timepoints observed in that window. Regardless of initial conditions, the protein level approaches the optimal value and then stably oscillates around it, with amplitudes similar to those observed in the control simulation with target transcription rates.

