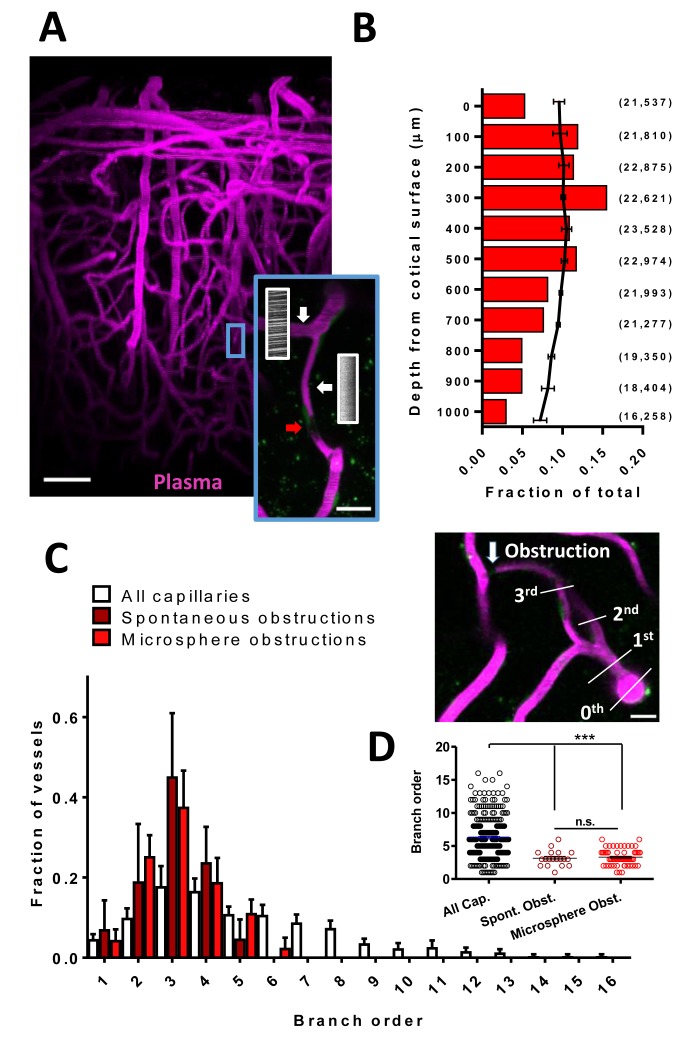
Figure 1. Cortical capillaries are prone to spontaneous obstruction.
(A) Side projection from in vivo two-photon imaging stack (0.027 mm3) showing pial surface at the top with labeled plasma (magenta). Insert shows a flowing (Note streaking pattern in line scans caused by RBC movement) and obstructed capillary (no streaks). Red arrow indicates occluding debris/cells. Scale bars are 50 µm and 15 µm for inset. (B) Distribution of microsphere obstructed capillaries as it relates to depth from the pial surface determined by confocal imaging from post-mortem brain sections. Red bars indicate the relative amount of microsphere obstructions for each depth expressed as a fraction of total obstructions. Black line indicates fraction of total capillaries by depth (error bars are 95% CI) as well as raw numbers of capillaries/ mm3 by depth are provided in parentheses. Note 0.04 obstructions occurred below 1000 μm from cortical surface but are not shown. (C) Distribution showing spontaneous and microsphere obstructed capillaries expressed as a function of arteriole branch order and relative to the distribution of all capillaries [n(all)=3 mice, 285 capillaries; n(spont.)=5 mice, 21 obstructions; n(micro.)=5 mice, 59 obstructions). Note that lower order capillaries are more susceptible to obstruction. Inset illustrates branch order which started with the penetrating arteriole (0 order branch). Scale bar 15 µm. (D) Mean branch order of spontaneous or microsphere-induced capillary obstructions ([one way ANOVA F(2,360)=32.36, p<0.0001, all capillaries compared to spontaneous obstructions unpaired t-test t(302)=4.180, p<0.0001, or microsphere obstructions unpaired t-test t(342)=6.95, p<0.0001; spontaneous vs microsphere obstructions t(76)=0.46, p=0.65]. ***p<0.001, n.s. = not significant. Error bars are S.E.M.

