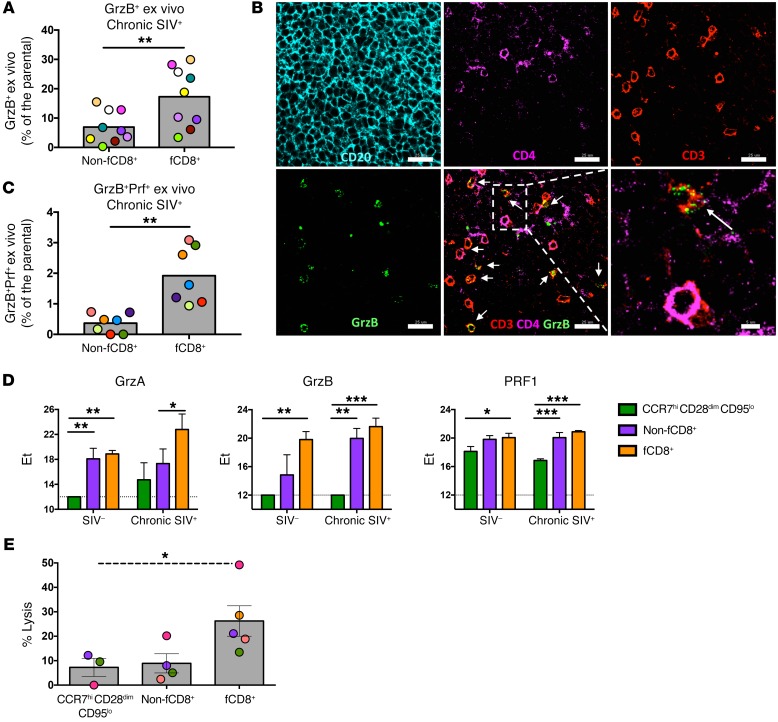
Figure 3. A high cytolytic profile of fCD8+ T cells is associated with potent in vitro bispecific antibody–mediated killing of infected cells.
(A) Pooled data showing the frequency of ex vivo GrzB expression in non-fCD8+ and fCD8+ T cell cells from chronically SIV-infected animals (n = 9). **P < 0.001, by Mann-Whitney U test. (B) Representative confocal image showing GrzB expression in CD8+ T cells (CD3+CD4–) within the GCs of a chronically SIV-infected LN. Individual staining and merged images (CD3/CD4/GrzB) are shown. Arrows highlight CD8+ T cells (defined as CD3+CD4-) positive for GrzB staining. Original magnification, ×63; scale bars: 25 μm and 5 μm (enlarged inset of white boxed area). (C) Pooled data showing expression of the GrzB+Prf+ cell population in non-fCD8+ and fCD8+ T cells from chronically SIV-infected animals (n = 7). Matching samples are highlighted with paired colors. **P < 0.001, by Wilcoxon paired test. (D) Fluidigm analysis of mRNA expression levels of granzyme A (GrzA), GrzB, and PRF1 among different CD8+ T cell subsets from chronically SIV-infected LNs (n =3). *P < 0.05, **P < 0.001, and ***P < 0.0001, by Wilcoxon paired test. (E) Level of in vitro bispecific antibody–mediated killing of infected cells in the presence of relevant sorted CD8+ T cells from chronically SIV-infected LNs (n = 5). Matching samples are highlighted with paired colors. *P < 0.05, by Kruskal-Wallis test.

