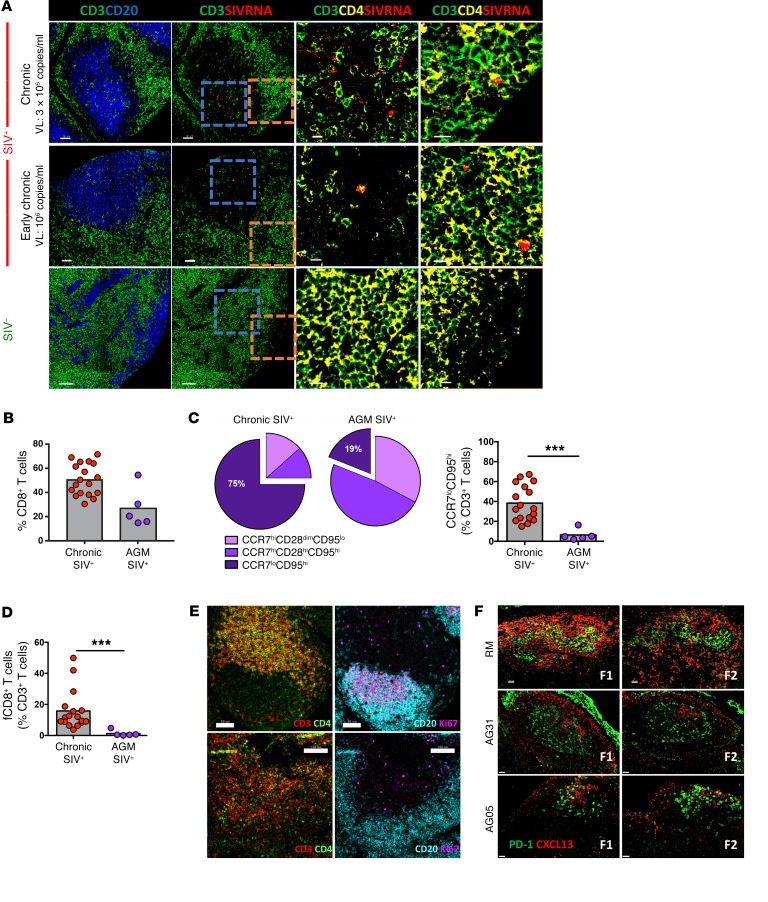
Figure 5. Immune activation is associated with the accumulation of fCD8+ T cells during chronic SIV infection.
(A) Representative confocal images showing CD20+, CD3+, and CD4+ staining with SIV RNA ISH (RNAscope). Follicular areas from a noninfected, an early chronic, and a late chronic SIV-infected LN are shown. SIV mRNA is shown in red. Scale bars: 50 μm and 10 μm (enlarged images of boxed areas). (B) Pooled data showing the relative frequency of total LN CD8+ T cells in chronically SIV-infected RMs (n = 17) and AGMs (n = 5), expressed as the frequency of total CD3+ T cells. Mann-Whitney U test. (C) Relative appearance of LN CD8+ T cell subsets (top) and frequency of LN CCR7loCD95hi CD8+ T cells (bottom) in chronically SIV-infected RMs (n = 17) and AGMs (n = 5). ***P < 0.0001, by Mann-Whitney U test. (D) Relative frequency of fCD8+ T cells. ***P < 0.0001, by Mann-Whitney U test. (E) Representative confocal images showing B cell follicles and T cell distribution in 2 SIV-infected AGMs. Individual staining and merged images (CD3/CD4 and CD20/Ki67) are shown. Scale bars: 50 μm (top) and 100 μm (bottom). Original magnification, ×20. (F) Confocal images showing the distribution of PD-1hi cells and the presence of CXCL13 in follicular areas from chronically infected RMs (n = 1) and AGMs (n = 2). Two follicles (F1, F2) from each animal are shown. Original magnification, ×40. Scale bars: 20 μm.

