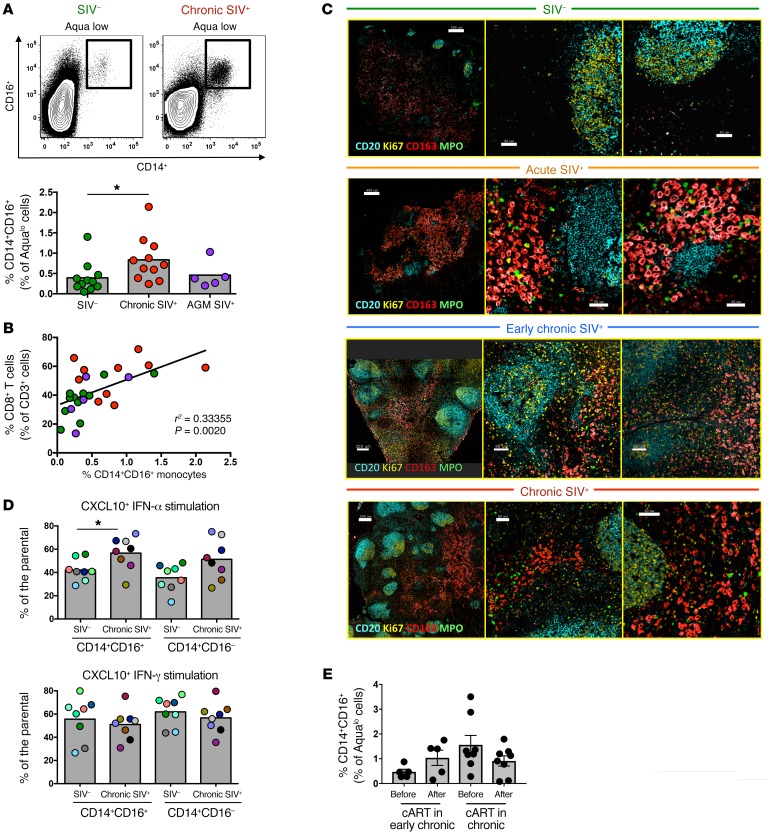
Figure 6. Accumulation of functional monocytes in proximity to follicular areas during SIV infection.
(A) Representative flow cytometric plots showing the gating scheme for identification of monocyte subsets and pooled data showing the relative frequency of CD14hiCD16hi monocytes in LNs from noninfected RMs (n = 11), chronically infected RMs (n = 11), and chronically infected AGMs (n = 5). *P < 0.05, by Mann-Whitney U test. (B) Linear regression analysis showing the association between the frequency of LN CD14hiCD16hi monocytes and LN total CD8+ T cells. (C) Representative confocal images showing the distribution of monocytes (CD163hi, in red) and granulocytes (MPOhi, in green) in LN tissues from noninfected and acutely and chronically SIV-infected RMs. Two zoomed areas close to the B cell follicle (defined by CD20 and Ki67 expression) from each animal are also shown. Scale bars: 400μm (top two), 200 μm (third row), and 300 μm (lower); enlarged 50 μm; 40 μm (second row, right). Original magnification, ×20. (D) Pooled data showing CXCL10 production by CD14hiCD16hi and CD14hiCD16lo monocytes (flow cytometric intracellular staining analysis) after short in vitro stimulation with either IFN-α or IFN-γ. Cells from noninfected (n = 8) and chronically SIV-infected (n = 8) RMs were analyzed. *P < 0.05, by Mann-Whitney U test. (E) Relative frequency of LN CD14hiCD16hi monocytes before and after cART from RMs treated during early (n = 5) or late (n = 8) SIV infection. Mann-Whitney U test for unpaired comparisons and Wilcoxon test for paired comparisons.

