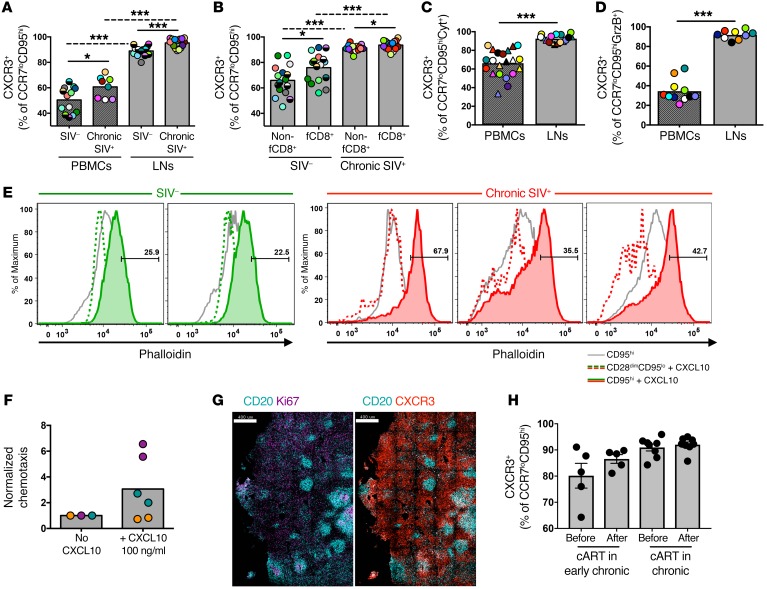
Figure 7. The majority of LN CD8+ T cells express a functional CXCR3 receptor.
(A) Pooled data showing the relative frequency of CXCR3hiCCR7loCD95hi CD8+ T cells in samples of PBMCs (n = 13 SIV–; n = 8 chronic SIV) and LNs (n = 16 SIV–; n = 16 chronic SIV). *P < 0.05 and ***P < 0.0001, by Mann-Whitney U test for unpaired comparisons (solid lines) and Wilcoxon test for paired comparisons (dotted lines). (B) Pooled data showing the relative frequency of CXCR3hi non-fCD8+ and fCD8+ T cells from noninfected (n = 16) and chronically SIV-infected RMs (n = 16). *P < 0.05 and ***P < 0.0001, by Mann-Whitney U test. Dotted lines show paired analysis (Wilcoxon test). (C) Pooled data showing the frequency of CXCR3hi SIV-specific CCR7loCD95hi CD8+ T cells identified after short ex vivo stimulation with Gag (circles) or Env (triangles) peptide pools (Cyt+, IFN-γ, and/or TNF-α and/or MIP-1β). ***P < 0.0001, by Wilcoxon paired test. (D) Frequency of CXCR3hiCCR7loCD95hi CD8+ T cells that expressed an ex vivo GrzBhi phenotype in PBMC (n = 11) and LN (n = 9) samples from chronically SIV-infected RMs. Matching samples are highlighted with paired colors. ***P < 0.0001, by Mann-Whitney U test. (E) Histograms depicting F-actin mobilization, judged by phalloidin increase, in naive (CD28dimCD95lo) and memory CD95hi CD8+ T cells after short (5 s) ex vivo stimulation with CXCL10. Data from 2 noninfected and 3 chronically SIV-infected animals are shown. (F) Normalized chemotaxis levels of CD8+ T cells from SIV-infected LNs (n = 3) after a 3-hour stimulation with CXCL10. Matching samples are highlighted with paired colors. No statistically significant difference was found by Wilcoxon paired test. (G) Representative confocal images showing CXCR3 expression within LNs of a chronically SIV-infected RM. Scale bars: 400 μm. Original magnification, ×20. (H) Pooled data showing the relative frequency of CXCR3hiCCR7loCD95hi CD8+ T cells before and after cART from RMs treated during early (n = 5) or late (n = 8) SIV infection. Mann-Whitney U test for unpaired comparisons and Wilcoxon test for paired comparisons.

