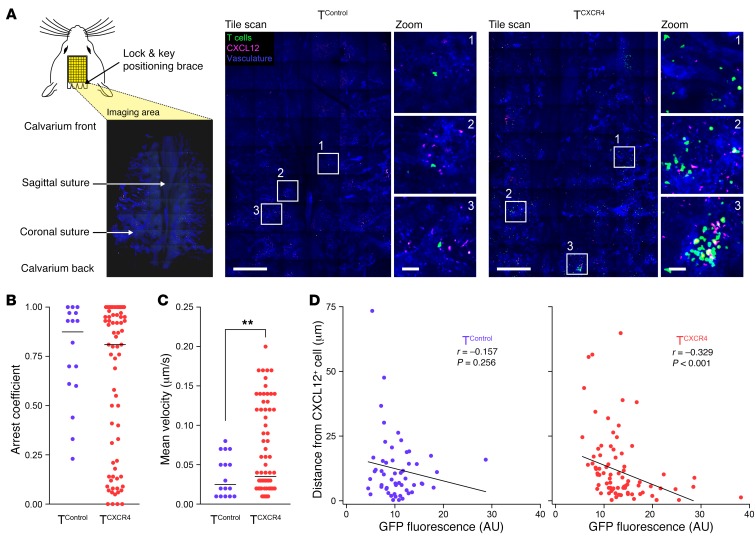
Figure 2. TCXCR4 show enhanced motility and directed migration to vascular-associated CXCL12+ cells in BM.
(A) Left: Diagram showing strategy for calvarial imaging. Right: Intravital confocal calvarial imaging of transduced T cells (green) was performed 8 weeks after injection of TControl and TCXCR4 into separate Rag1ko mice. Representative maximum projection tile scans and corresponding high-magnification insets are shown following i.v. injection of anti-CXCL12–PE (red) and Cy5-dextran to identify vasculature (blue). Scale bars: 500 μm in low-magnification images, 50 μm in inset images. (B) Summary graph showing arrest coefficient data for time-lapse imaging of TControl and TCXCR4. Data are pooled from 5 mice (n = 2 TControl and n = 3 TCXCR4). Median tracking period was 8.5 min/cell, range 8.5–30 min/cell (total number of cells tracked n = 72 TCXCR4, n = 16 TControl). (C) Summary graph showing mean velocity of tracked cells. Statistical comparison was made using a t test (2-tailed). **P ≤ 0.01. (D) X-y graphs showing GFP intensity (x axis) versus distance (y axis) of individual TControl (n = 54, left) and TCXCR4 (n = 108, right) from CXCL12+ cells measured on static images derived from the same experiments in A–C. Inset to each graph shows Pearson’s correlation coefficient r and significance value.

