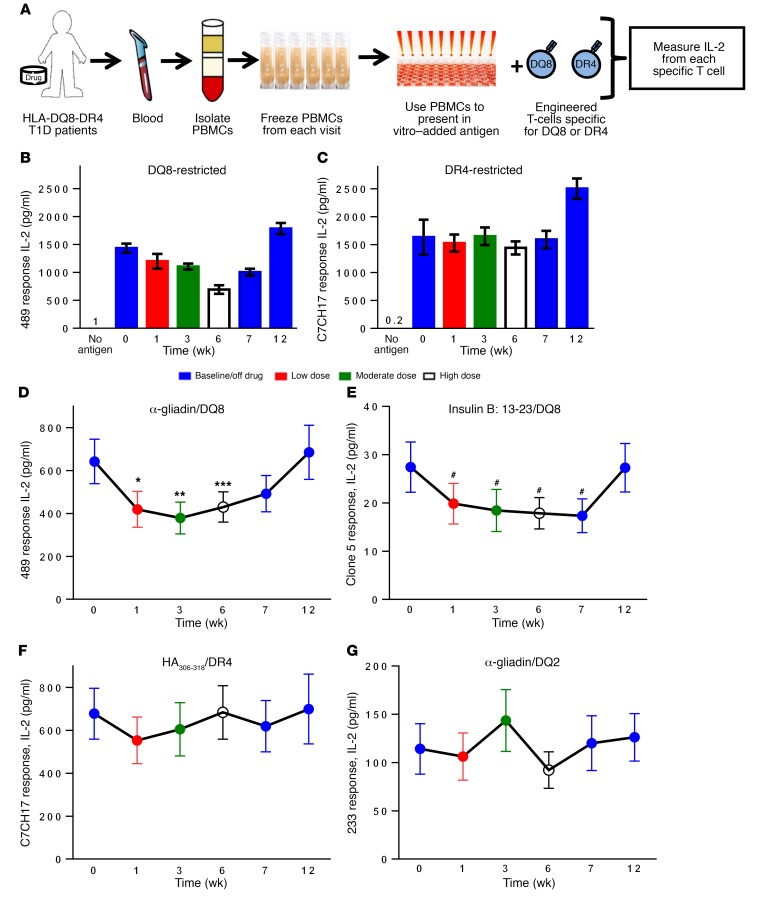
Figure 5. Methyldopa treatment specifically blocks DQ8 antigen presentation in recent-onset T1D patients with the DQ8 allele.
(A) Diagram of the assay used to monitor specific MHC class II antigen presentation. PBMCs from participants were isolated and frozen after each study visit. These primary PBMCs were then thawed and used as APCs to stimulate engineered T cells (TCR transductants) that respond to a specific peptide presented by a given MHC class II molecule (DQ8, DR4, or DQ2). Secreted IL-2 from each TCR transductant was measured using a highly sensitive ELISA. (B) Individual study subject response for 489 (DQ8-restricted) and (C) C7CH17 (DR4-restricted). Data represent the mean ± SEM from triplicate wells at each time point during the study. Colors represent the durations on and off the drug. Participants underwent dose titration, with a low dose (500 mg 2 times/day), moderate dose (500 mg 3 times/day), and high dose (2–3 grams over the course of the day), and then went off the drug. “No antigen” indicates that there was no antigen added in vitro in the assay. (D) Summative data on study participants (n = 20) showing their responses to 489 and (E) clone 5, both of which were DQ8 restricted. *P = 0.001, **P < 0.001, ***P = 0.02, and #P < 0.01, using a longitudinal mixed-effects model that compared the least-squares mean at each time point with baseline. (F) Data from study participants with DR4 subtypes (n = 18) able to present and stimulate the HA306-318–restricted TCR transductant C7CH17. (G) Response to a DQ2 TCR transductant (233 responding to α-gliadin62-73) for the study duration in subjects with a DQ2 allele (n = 7). The negative control (no antigen added to culture) resulted in IL-2 levels below 2 pg/ml for each subject and for individual TCR transductants. Data in D–G are depicted as the least-squares mean ± SEM for the study cohort; individual responses are shown in Supplemental Figure 10.

