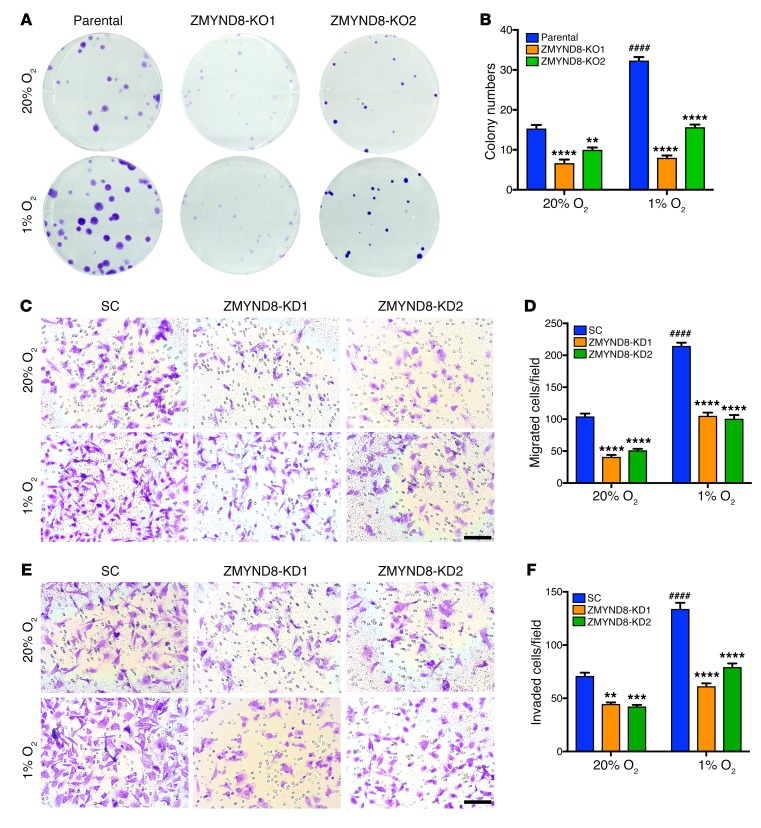
Figure 3. ZMYND8 depletion suppresses tumorigenic potential of breast cancer cells in vitro.
(A and B) Colony formation of parental and ZMYND8-KO1 or -KO2 MDA-MB-231 cells cultured under 20% or 1% O2 for 12 days. Representative images from 3 experiments are shown in A. Quantification of colony numbers is shown in B (mean ± SEM, n = 3). ####P < 0.0001 versus parental at 20% O2, **P < 0.01, ****P < 0.0001 versus parental, by 2-way ANOVA with Tukey’s t test. (C–F) Migration (C and D) and invasion (E and F) of SC and ZMYND8-KD1 or -KD2 MDA-MB-231 cells under 20% or 1% O2. Representative images from 3 experiments are shown in C and E. Migrated and invaded cell numbers are quantified in D and F, respectively (mean ± SEM, n = 3). ####P < 0.0001 versus SC at 20% O2, **P < 0.01, ***P < 0.001, ****P < 0.0001 versus SC, by 2-way ANOVA with Tukey’s t test. Scale bar, 100 μm.

