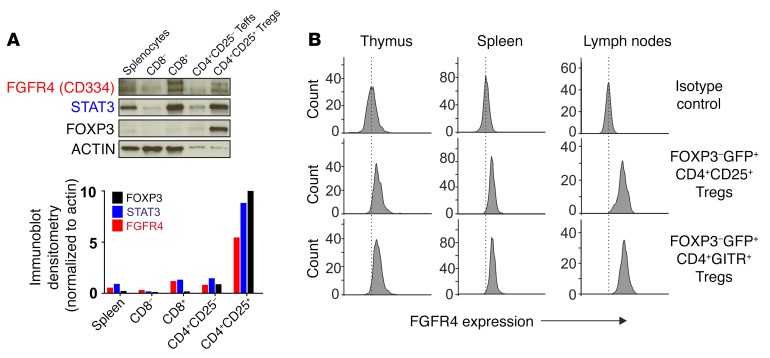
Figure 1. Expression analysis of FGFR4 in lymphocytes.
(A) Representative immunoblot analysis of FGFR4, STAT3, and FOXP3 proteins in purified and pooled lymphocytes (n = 13 adult mice). The histogram shows digital quantification normalized to actin expression bands. The data shown are representative of 3 independent cell isolation and immunoblot experiments. (B) Expression analysis for FGFR4 in CD4+CD25+ and CD4+GITR+ regulatory lymphocytes using fluorochrome-conjugated antibodies in blood, mesenteric lymph nodes, spleen, and thymus isolated from 7-month-old Foxp3-GFP reporter mice. Plots are representative of 5 independent biological replicates.

