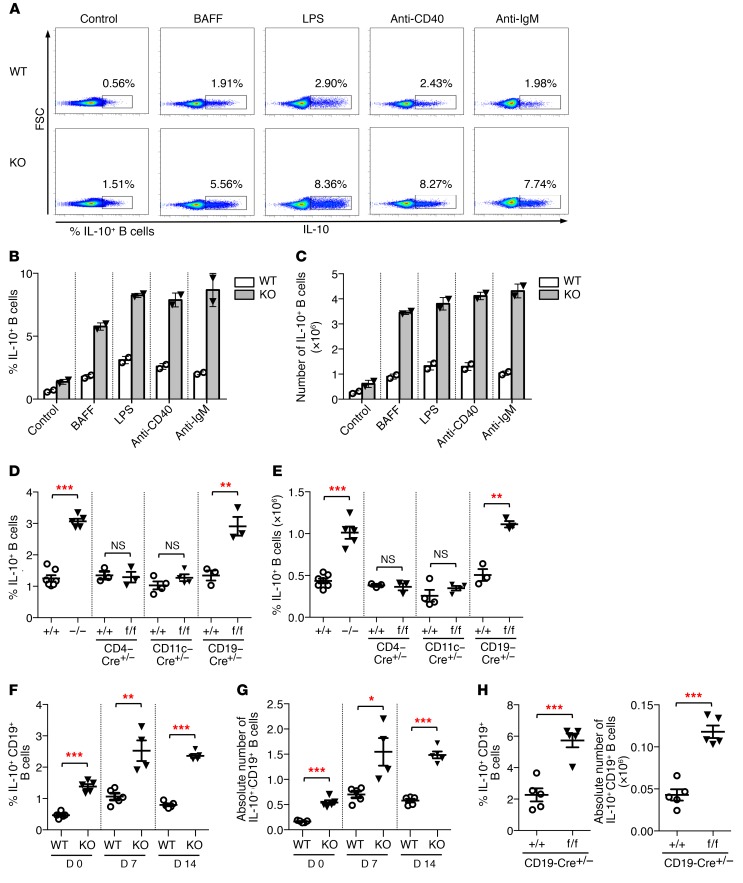
Figure 3. Toso deficiency results in increased numbers of IL-10–producing B cells.
(A–C) Purified B cells from WT and Toso–/– (KO) mice were treated with BAFF, LPS, αCD40, or αIgM for 24 hours. For the last 5 hours, cells were stimulated with PMA/ionomycin in the presence of brefeldin A (BFA)/monensin and subsequently analyzed for IL-10 production. (A) Representative flow cytometric analysis. (B and C) Bar graphs show frequency (B) and absolute numbers (C) of IL-10–positive B cells. Data are mean ± SEM from 2 cultures derived from different mice. (D and E) B cells from mice with straight and conditional Toso knockout, as well as the indicated control mice, were stimulated for 5 hours with LPS and PMA/ionomycin in the presence of BFA/monensin. Frequency (D) and number (E) of IL-10–positive B cells were determined by intracellular cytokine staining. (F and G) WT and Toso–/– (KO) mice were infected i.n. with 50 PFU influenza virus strain A/PR8 (H1N1). At the indicated days p.i., splenocytes were restimulated ex vivo, and the frequency (F) and number (G) of IL-10–positive CD19+ B cells were quantified by intracellular cytokine staining. (H) CD19-Cre+/– mice and Tosof/f/CD19-Cre+/– mice were infected i.n. with 1,000 PFU influenza virus strain A/PR8 (H1N1). Lung cells isolated on day 9 p.i. were restimulated ex vivo, and number and frequency of IL-10–positive CD19+ B cells were quantified by intracellular cytokine staining. Each symbol represents an individual mouse; horizontal lines indicate the mean ± SEM. (D and E) n = 3–7; (F–H) n = 4–5. *P < 0.05; **P < 0.01; ***P < 0.001; Student’s t test. Data are representative of at least 3 independent experiments.

