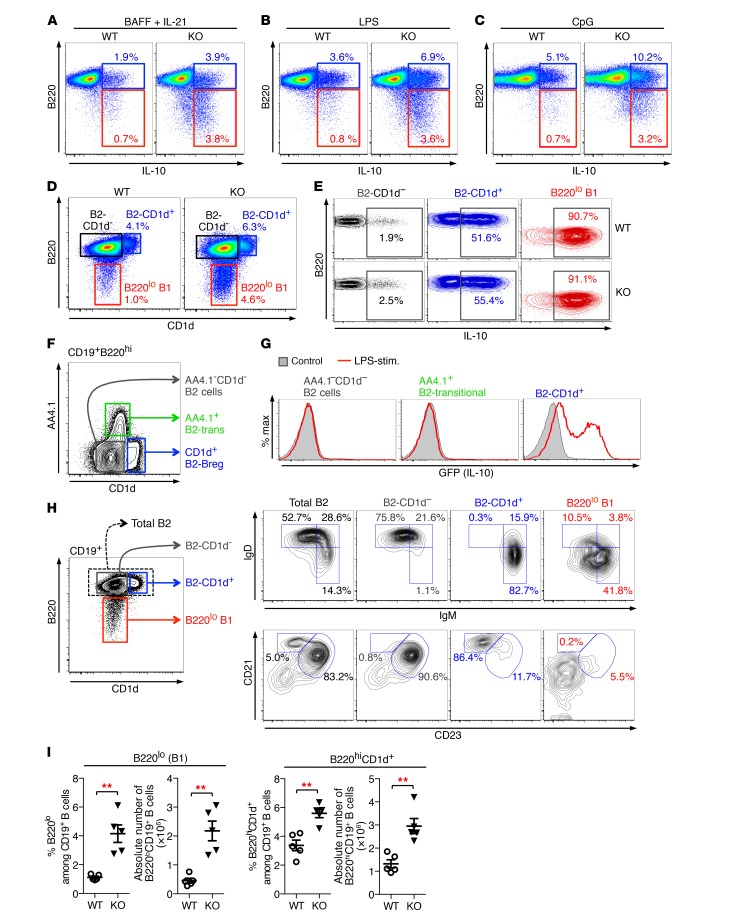
Figure 4. Phenotypic characteristics of IL-10–competent B cell subsets.
(A–C) Purified B cells from WT and Toso–/– (KO) mice were cultured for 16 hours with BAFF plus IL-21 (A), LPS (B), or CpG oligonucleotides (C). For the last 5 hours, cells were treated with PMA/ionomycin in the presence of BFA/monensin and CD19+ B cells analyzed for IL-10 production. (D) B220 versus CD1d staining on naive CD19+ B cells from WT and Toso–/– (KO) mice. (E) B220hi B2-CD1d– B cells (black), B220hi B2-CD1d+ B cells (blue), and B220lo B1 B cells (red) from WT and Toso–/– (KO) mice were purified by FACS. Cells were stimulated for 16 hours with LPS plus PMA/ionomycin/BFA/monensin during the last 5 hours and subsequently analyzed for IL-10 production. (F) CD19+B220hi B cells were analyzed for CD1d versus AA4.1 (CD93) staining to identify AA4.1–CD1d– B2-effector cells, AA4.1+ transitional B2 cells (B2-trans), and CD1d+ B2-Bregs. (G) AA4.1–CD1d– B2-effector cells, AA4+ B2-transitional cells, and CD1d+ B2-Bregs were purified from IL-10/GFP reporter (Vert-X) mice by flow cytometric cell sorting. Cells were treated for 16 hours with LPS plus PMA/ionomycin during the last 5 hours and analyzed for GFP (IL-10) expression. (H) Flow cytometric analysis of naive B cells from C57BL/6J mice. Left panel is gated on CD19+ B cells and shows gating for total B2 cells (B220hi), B220hiCD1d– B2 cells, B220hiCD1d+ B2 cells, and B220lo B1 cells. FACS profiles on the right show expression of IgM versus IgD (top panel) and CD23 versus CD21 (bottom panel) on the indicated B cell subsets. (I) Number and frequency of splenic B220lo B1 B cells and B220hiCD1d+ B2 B cells in WT and Toso–/– (KO) mice. Each symbol represents an individual mouse; horizontal lines indicate the mean ± SEM. n = 5; **P < 0.01; Student’s t test. Data are representative of at least 3 independent experiments.

