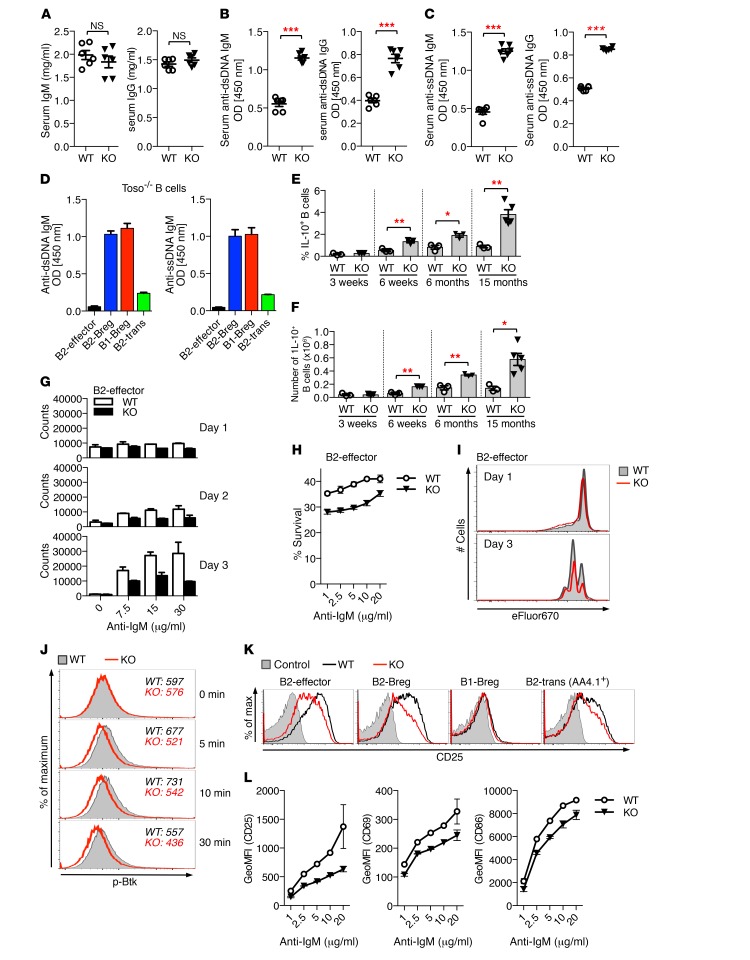
Figure 6. Self-reactivity of regulatory B cell subsets and altered activation thresholds of Toso-deficient B cells.
(A–C) Serum from 8- to 10-month-old female WT and Toso–/– (KO) mice was analyzed for total IgM and IgG levels (A) and titers of IgM and IgG antibodies against dsDNA (B) and ssDNA (C). n = 6. (D) Sorted B220hiAA4.1–CD1d– B2-effector cells, B220hiCD1d+ B2-Bregs, B220hiAA4.1+ B2-transitional cells (B2-trans), and B220lo B1-Bregs from Toso–/– mice were treated for 3 days with LPS. Culture supernatants were analyzed for anti-dsDNA and anti-ssDNA IgM levels (n = 2). (E and F) Frequency (E) and numbers (F) of IL-10–positive splenic B cells from WT and Toso–/– mice of the indicated ages. n = 3–5. (G and H) Sorted B2-effector cells from WT and Toso–/– (KO) mice were stimulated for the indicated durations with titrated amounts of anti-IgM and analyzed for cell counts (n = 2) (G) and cell survival (n = 4) (H). (I) Sorted B2-effector cells were labeled with eFluor670, stimulated with anti-IgM, and analyzed for cell division. (J) Sorted B2-effector cells from WT (gray filled) and Toso–/– (KO) (red line) mice were stimulated for the indicated durations with anti-IgM and analyzed for phospho-Btk (p-Btk) staining. (K and L) Sorted B cell subsets were stimulated for 16 hours with anti-IgM and analyzed for B cell activation markers. (K) Representative flow cytometric histograms for CD25 expression. WT, black; Toso–/– (KO), red line; unstimulated control, gray filled. (L) Sorted B2-effector cells were analyzed for anti-IgM–induced upregulation of CD25, CD69, and CD86. Data show the geometric mean fluorescence intensity (GeoMFI) (n = 2). Data are expressed as the mean ± SEM. *P < 0.05; **P < 0.01; ***P < 0.001; Student’s t test. All data are representative of 2 to 4 independent experiments.

