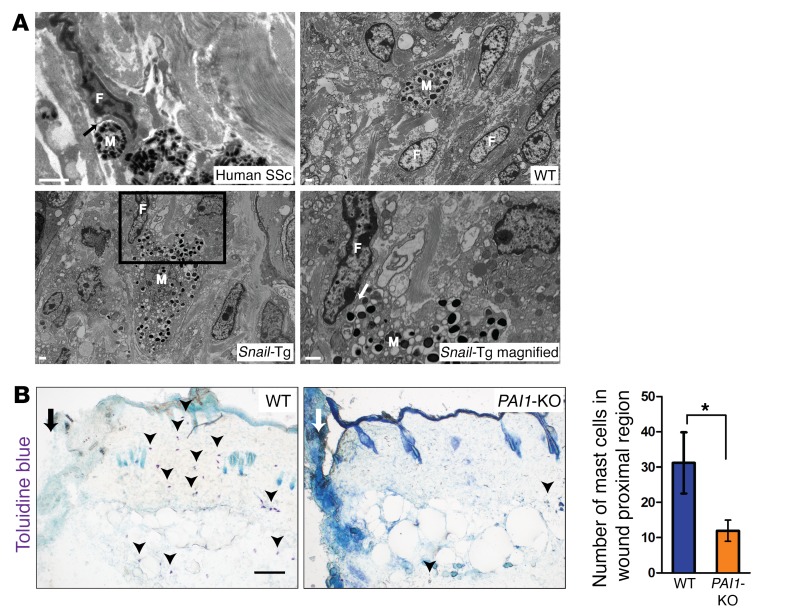
Figure 3. Recruitment of mast cells and direct binding to fibroblasts.
(A) Scanning electron micrographs of mast cells (M) and fibroblasts (F) in skin samples from a human scleroderma patient (scale bar: 500 nm; black arrow indicates an area of direct mast cell–fibroblast interaction), and WT and Snail-Tg mice (scale bars: 1 μm). The magnified view of the boxed area shows direct fibroblast–mast cell interaction in Snail-Tg skin (scale bar: 1 μm; n = 2; white arrow denotes an area of direct fibroblast–mast cell interaction). (B) Toluidine blue staining for mast cells (arrowheads) in proximal wound region (marked by an arrow; scale bar: 100 μm) 1 day after injury in WT and Pai1-KO skin. Graph shows the quantification of mast cells in WT and Snail-Tg skin (n = 3). Data represent the mean ± SEM. *P < 0.05, by Student’s t test.

