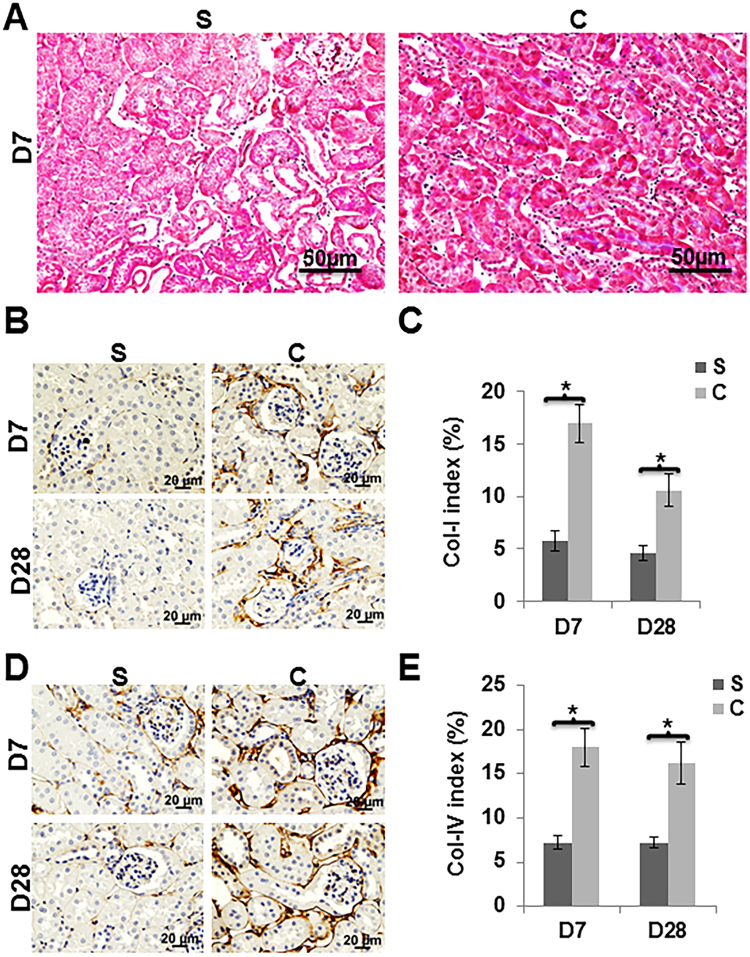
Figure 5.
Tissue fibrosis was assessed by Masson’s Trichrome staining, Col-I and Col-IV levels using immunohistochemistry. Masson’s trichrome staining was performed on kidney sections at 28 days post contrast (C) or saline (S) administration. A representative image of Masson’s Trichrome staining on day 28 is shown (A). There is increased tubular fibrosis (blue color) in animals with contrast (C) administration compared to saline (S). Representative images of collagen-1 (B) and collagen-IV (D) staining at 7 (D7) and 28 (D28) are depicted. The percentage of brown staining over tissue area was calculated using Zen 2.3 software (C and E). There was significantly higher collagen-I (C) and collagen-IV (E) staining in kidney with C administration compared to S. All images are at 40X magnification. Each bar in the bar diagram represents mean ± SEM of 4–6 animals per group. Two-way ANOVA with Student t test was performed with Bonferroni correction was performed. Significant differences between the respective time points among C and S indicated by * at P < 0.05.

