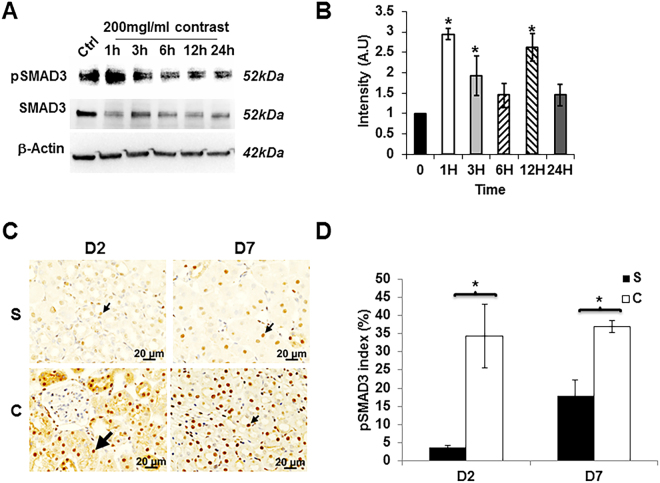
Figure 7.
Contrast exposure increases pSMAD3 in vitro and in vivo. Western blot analysis of pSMAD3 in HK-2 cells treated with contrast at indicated time points (A) and image quantification (B). There is a significant increase in the mean pSMAD3/SMAD3 levels in the HK-2 cells treated with contrast compared to baseline (Ctrl) at 1, 3, and 12 hours (P < 0.05). (C) is a representative image of immunostaining for pSMAD3 in kidney sections with contrast (C) administration or saline (S) at day 2 (D2) or day 7 (D7). All images are at 40X magnification. Arrowhead indicates brown nuclei positive, which are for pSMAD3. The percentage of pSMAD3 positive nuclei over total number of nuclei was presented in the bar graph (D). Each bar represents mean ± SEM of 4–6 animals per group. Two-way ANOVA with Student t test with Bonferroni correction was performed. Significant differences between the respective time points among C and S indicated by * at P < 0.05.

