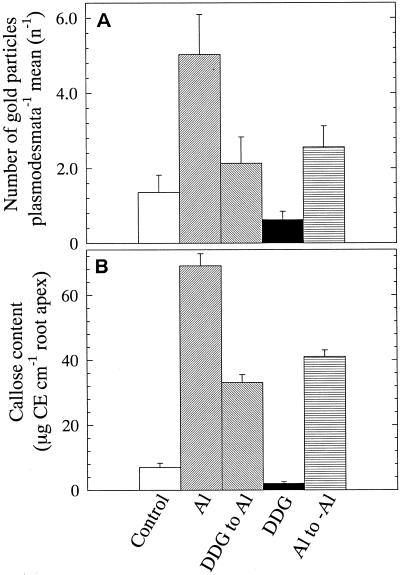
Figure 4.
Quantitative evaluation of Al-induced callose formation at PD regions by immunogold labeling (A) and spectrofluorometric quantification of callose (Curdlan equivalents, CE) at the 5-mm root apex (B) of wheat cv Scout 66 plants subjected to a range of indicated treatments. A, Values are number of gold particles counted per individual PD (out of approximately 30–35 PD) alone or organized to pit-fields mean value (average) ± se. B, Values are mean ± se of five independent replicates each comprising three 5-mm root segments. While counting gold particles per individual PD especially in control cells, there were some PD, which are weakly labeled and were also included in counting statistics. By contrast, after Al treatments the labeling was much clearer and there were no zero scores. Presented images are representative pattern of at least two independent experiments.

