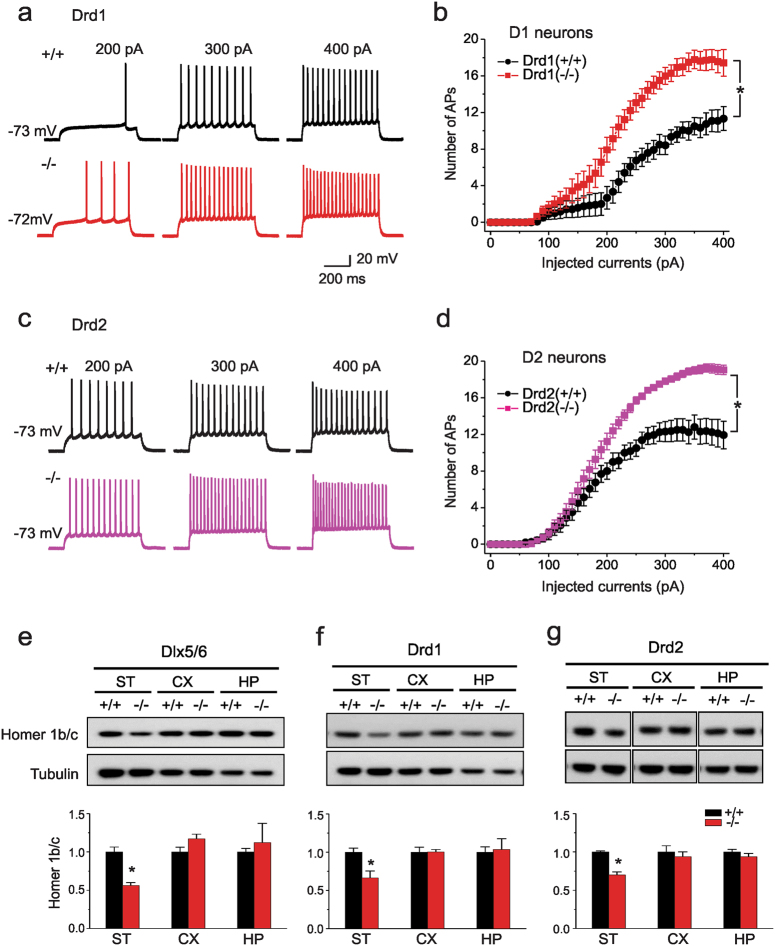
Fig. 4. Loss of Shank3 in selected striatal neurons leads to cell autonomous alterations of synaptic function and PSD components.
(a) Representative traces of evoked action potentials in D1 MSNs neurons from Drd1-Shank3 WT (+/+) (black) and KO (−/−) (red) mice. The action potentials reflect responses to 200, 300, and 400 pA current injections, respectively. b Summarized data for the number of evoked action potentials (APs) at the indicated amplitudes of current injection in D1 MSNs from Drd1-Shank3 WT (+/+) and KO (−/−) mice (2-way ANOVA, main effects of genotype and stimulation, p < 0.001, genotype x stimulation interaction, p < 0.001). c Example traces of evoked action potentials in D2 MSNs neurons from Drd2-Shank3 WT (+/+) (gray) and KO (−/−) (pink) mice. d Summarized data for the numbers of evoked action potentials at the indicated amplitudes of current injection in D2 MSNs from Drd2-Shank3 WT (+/+) and KO (−/−) mice (2-way ANOVA, main effects of genotype and stimulation, p < 0.001, genotype x stimulation interaction, p < 0.001). e−g Homer1b/c levels in the PSD from striatum where loss of Shank3 was targeted. (e) Dlx5/6-Shank3 mice show a reduction in Homer1b/c protein in striatal (ST) (p = 0.002), but not in cortical (CX) or hippocampal (HP) PSD samples; n = 5 mice/genotype. f Drd1-Shank3 mice have decreased Homer 1b/c in ST (p = 0.018), but not in the CX or HP samples; n = 4 mice/genotype. g Drd2-Shank3 mice have a loss of Homer1b/c in the ST (p < 0.001), but not in the CX or HP; n = 4 mice/genotype. For all westerns, independent samples two-tailed t-tests; representative images are shown and each western was replicated at least two times. For all panels, *p < 0.05, compared to wild-type controls. All data are expressed as means ± SEM

