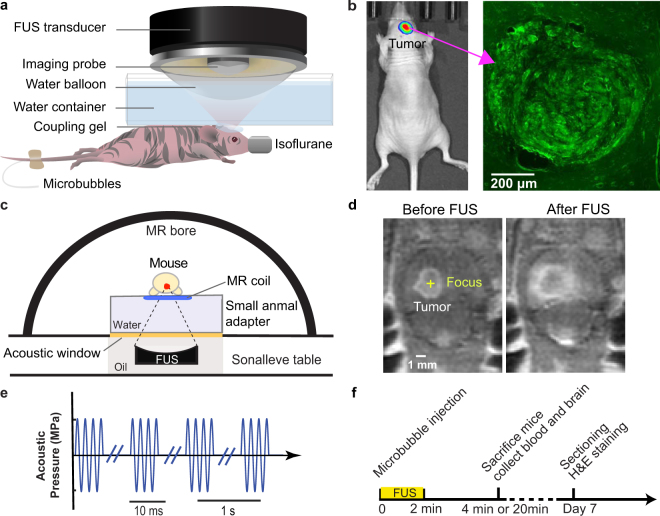
Figure 1.
Experimental method. (a) Schematic illustration of the FUS experiment setup for the treatment of U87 tumor-bearing mice. (b) Bioluminescence image of the orthotopic mouse model with the green fluorescence image of the mouse brain shown on the right. (c) Schematic illustration of the MRgFUS system for the treatment of GL261 tumor-bearing mice. (d) Representative contrast-enhanced MR images acquired before and after FUS treatment. The enhanced accumulation of the MR contrast agents in the tumor region verified accurate tumor targeting by the FUS. (e) Diagram of FUS pulses. (f) Illustration of the experimental timeline.

