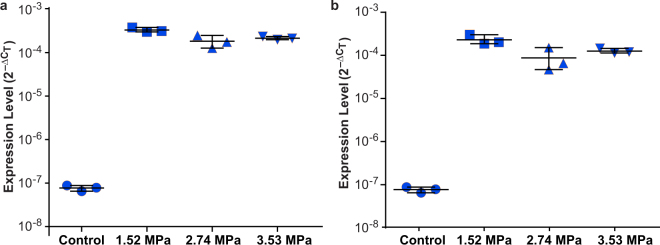
Figure 3.
Comparison of the circulating eGFP mRNA expression in the control and treated GL261 mice. Comparison of the expression levels () of (a) eGFP A and (b) eGFP B in the control group and three treatment groups with different acoustic pressures: 1.52 MPa, 2.74 MPa, and 3.53 MPa. All the measured data points as well as their mean and standard deviation are shown for each group. The circulating mRNA levels of eGFP A and eGFP B were significantly higher in the FUS-treated groups compared with the untreated control group (eGFP A: p = 0.0045; eGFP B: p = 0.0045). The expression levels of mice in the 1.52 MPa group was significantly higher than those of the other two groups for eGFP A and eGFP B (eGFP A: p = 0.012; eGFP B: p = 0.012).

