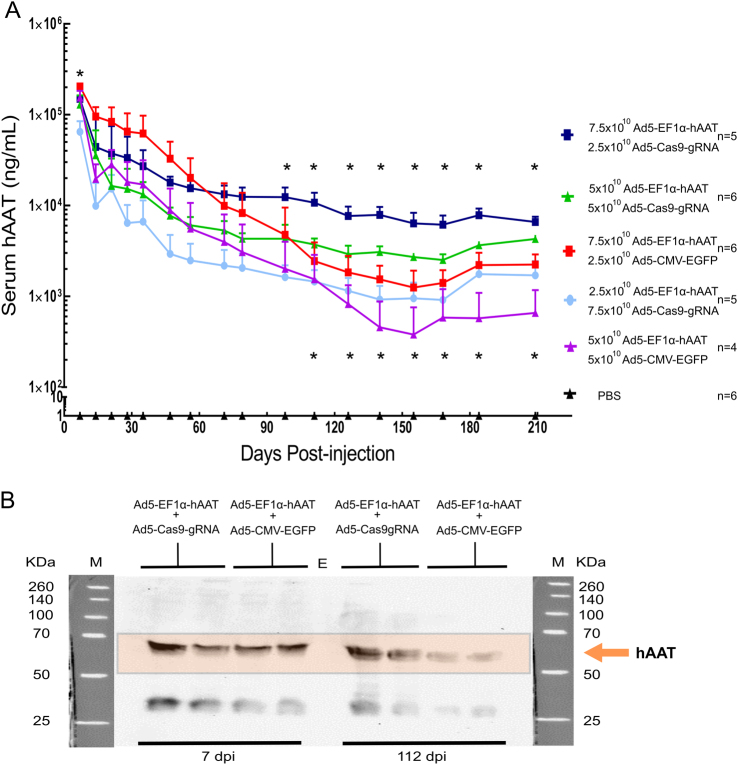
Fig. 3.
Somatic integration of hAAT maintains stable long-term gene expression in mice. a Mice were infected with a total of 1.0 × 10¹¹ VP recombinant adenoviruses or PBS (negative control). Over a 210-day period, plasma levels of hAAT were determined intermittently via ELISA. Black triangles represent mice injected PBS (n = 6). Red squares and a line indicate mice (n = 6) injected with Ad5-EF1α-hAAT (7.5 × 10¹⁰ VP) and Ad5-CMV-EGFP (2.5 × 10¹⁰ VP). Purple triangles and a line represent mice (n = 4) injected with Ad5-EF1α-hAAT (5.0 × 10¹⁰ VP) and Ad5-CMV-EGFP (5.0 × 10¹⁰ VP). Dark blue squares and line indicate mice (n = 5) injected with Ad5-EF1α-hAAT (7.5 × 10¹⁰ VP) and Ad5-Cas9-gRNA (2.5 × 10¹⁰ VP). Green triangles and line show mice (n = 6) injected with Ad5-EF1α-hAAT (5.0 × 10¹⁰ VP) and Ad5-Cas9-gRNA (5.0 × 10¹⁰ VP). Closed circles and line with a light blue color indicate a mice group (n = 5) injected with Ad5-EF1α-hAAT (2.5 × 10¹⁰ VP) and Ad5-Cas9-gRNA (7.5 × 10¹⁰ VP). *Significant differences with a pvalue < 0.05 between equivalent groups, while an absence of asterisk represents no significant difference. The top asterisk row represents the 3:1 vector group comparison (Ad5-EF1α-hAAT: Ad5-CMV-EGFP or Ad5-EF1α-hAAT: Ad5-Cas9-gRNA) (squares) and the bottom asterisk row represents 1:1 vector groups (triangles). Error bars are s.d. of the mean. b One microliter of plasma samples were run on SDS-PAGE followed by Western blot analysis to visualize the temporal change of gene expression between day 7 and day 112 in integrative versus episomal groups. Each lane represents one sample from one mouse. Image is representative of three blots. M and kDa indicate molecular mass marker and kilo-Daltons, respectively

