Figure 1.
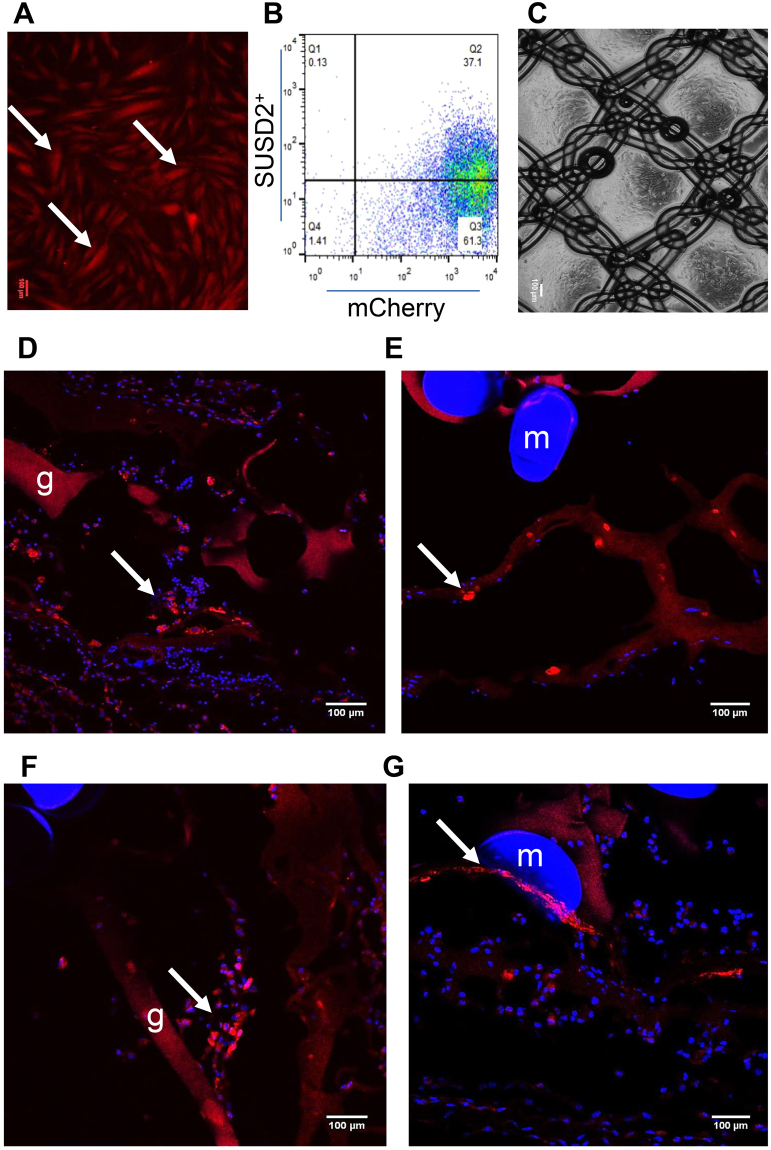
eMSC transduction and survival of eMSC on PA + G mesh in NSG mice. (A) cultured mCherry transduced eMSC showing red fluorescence, (B) more than 95% of transduced and cultured eMSC were mCherry+ by flow cytometry and about 40% of this population were SUSD2+. Representative trace of n = 6 patient samples, (C) PA + G mesh seeded and cultured with eMSC. (D,E) mCherry+ eMSC were observed 3 and (F,G) 7 days post-implantation around the mesh filaments in immunocompromised NSG mice. Arrows, representative mCherry+ eMSC; m, mesh filament; g, gelatin. Scale Bars 100 µm.

