Figure 4.
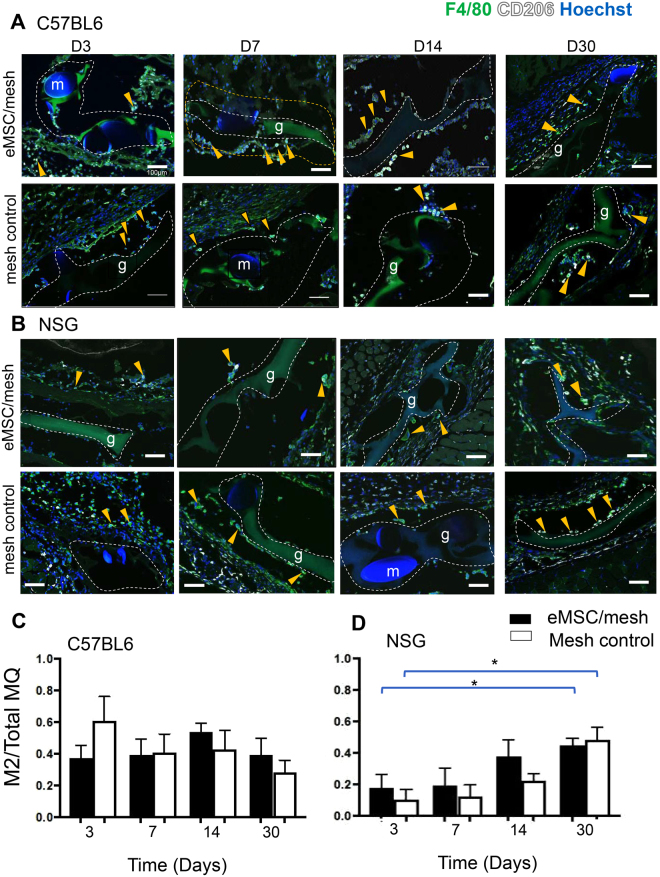
M2 macrophage quantification around implanted mesh in C57BL/6 and NSG mice. CD206 M2 macrophage (white) co-localized with the pan macrophage F4/80 marker (green) in (A) C57BL/6 mice and in (B) NSG mice. The ratio of CD206+ macrophages to total F4/80 macrophages (MQ) in the first 100 µm increment around mesh filaments in (C) C57BL/6 and in (D) NSG mice. Data are mean ± SEM of n = 6 animals/group and were analyzed by two-way ANOVA. *P < 0.05. Arrows show representative CD206+F4/80+ macrophages within and outside the 100 µm increment around PA + G mesh, m, mesh filament; g, gelatin. Scale Bars 100 µm.

