Figure 3.
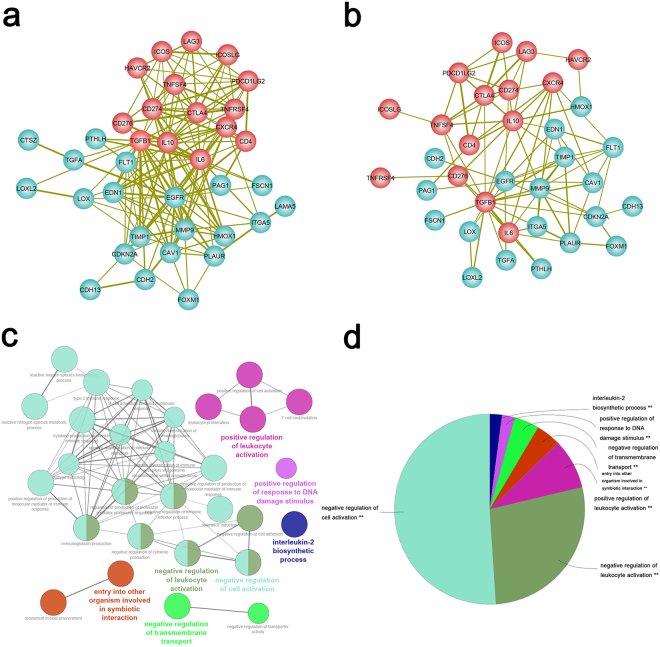
Integrated network and functional annotation. (a) EMT-related genes are indicated as cyan circles, immune checkpoint targets are indicated as red circles. The thickness of the lines depends on the combined score in the PPI network. (b) A combined network contains both a protein-protein interaction network (PPI) and gene co-expression information. The thickness of the lines depends on the combination coefficient (|co-expression correlation coefficients of mRNAs* combined score in the PPI network|). (c) Functional annotation of two correlated signatures. (d) Proportion of different functional groups.

