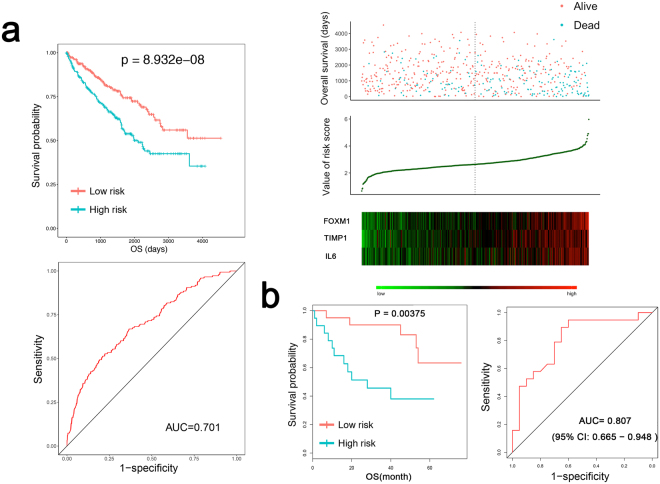
Figure 5.
Distinguishing ability of the risk score for the clinical status. (a) The Kaplan-Meier test of the risk score for overall survival. P = 8.932e-08. Prognostic performance of the risk score as shown by the time-dependent receiver operating characteristic (ROC) curve for predicting the 5-year survival. The area under the curve (AUC) = 0.701. Patients were divided into high- and low-risk groups using the risk score. The relationship between survival and the risk score is shown at the top; the risk score curve is presented in the middle; heatmap of patients with 3 signatures is on the bottom. (b) Validation of the risk score in the GEO dataset (GSE29609). The Kaplan-Meier test of the risk score for overall survival (n = 39, p value = 0.00375). Prognostic performance of the risk score as shown by the time-dependent receiver operating characteristic (ROC) curve for predicting the 5-year survival. Area under the curve (AUC) = 0.807.

