Figure 1.
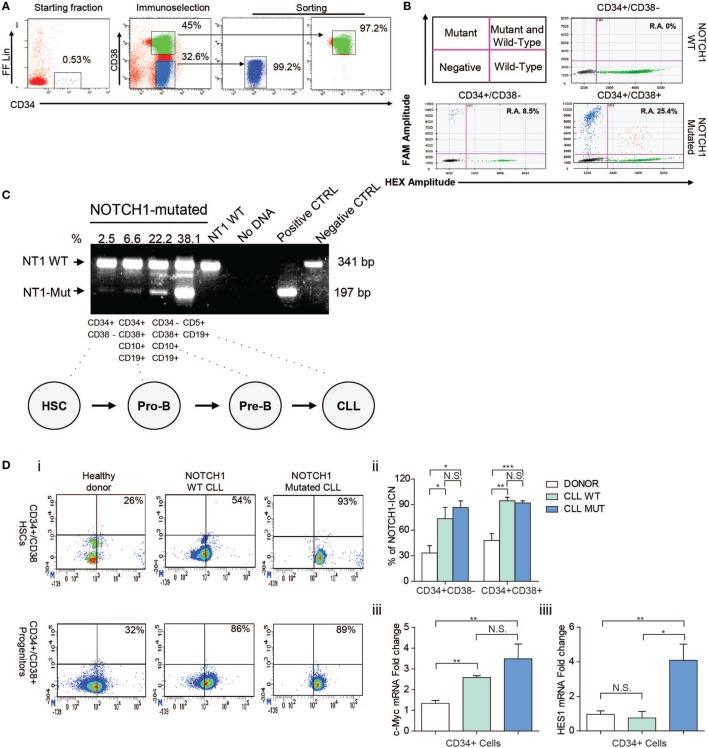
Analysis of NOTCH1 gene mutation and signaling in bone marrow (BM) hematopoietic stem cells (HSCs) and progenitors cells. (A) FACS-setting used for HSCs and progenitor cells sorting purification of one representative NOTCH1-mutated patient. Prospective cell separation included immunoselection (middle plot) and sorting (right plot) to ensure purity and lack of chronic lymphocytic leukemia (CLL) cell contamination for NOTCH1 mutation analysis. (B) Droplet digital PCR. Upper left panel is a schematic representation of positive and negative droplet distribution according to the fluorophore threshold indicated in magenta lines. Upper right and lower panels are representative scatterplots of wild type and NOTCH1 mutated HSCs and progenitor cells, respectively. (C) Results of the allele-specific PCR assay for delCT NOTCH1 mutation in HSCs (CD34+CD38−), pro-B progenitors (CD34+CD38+CD10+CD19+), pre-B cells (CD34−CD38+CD10+CD19+), and B neoplastic CLL (CD5+CD19+) from one NOTCH1-mutated CLL sample. CD5+CD19+ cells from a NOTCH1-WT patient were used as negative control and showed a normal band of 341 bp. Samples bearing the delCT NOTCH1 mutation showed an additional mutant band of 197 bp. (D) (i) Representative dot plots of healthy control, NOTCH1 wild type, and NOTCH1 mutated CLL BM samples showing expression of NOTCH1-ICN on CD34+/CD38− HSCs and CD34+/CD38+ progenitors compartments. (ii) Bar graphs show the means ± SD of the percentage of NOTCH1-ICN positive cells. *p < 0.05, **p < 0.01, ***p < 0.001 according to Student’s t-test; (iii) real-time PCR analysis of c-MYC and Hes1 gene expression in CD34+ BM cells. mRNA levels were normalized to GAPDH and represented as fold change using healthy control cells as a reference.

