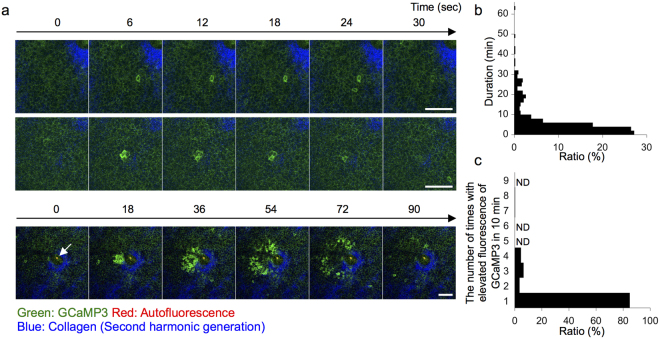
Figure 2.
Three patterns of transient [Ca2+]i elevation in the basal layer. (a) Representative time-lapse images of the basal layer of the ear skin of GCaMP3 mice. Upper panel: Ca2+ spike in a single cell unit. Middle panel: clustered Ca2+ spike. Lower panel: radially spreading Ca2+ spike. Arrow: hair shaft. Green: GCaMP3; red: autofluorescence; blue: second-harmonic generation from dermal collagen. (b) Relationship between the duration and the proportion of Ca2+ spikes in a single cell unit (n = 416 events). (c) Relationship between the number of times and the proportion of Ca2+ spikes in a single cell unit (n = 310 cells) in 10 min. ND: not detected. Scale bars: 50 μm. Results are representative of at least three independent experiments.

