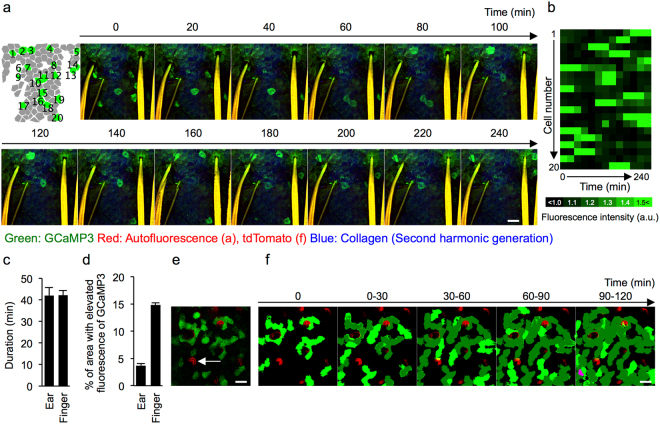
Figure 3.
Dynamics of [Ca2+]i elevation in the granular layer. (a) Schematic (far left) and representative time-lapse images of the granular layer of the ear skin of GCaMP3 mice. Green: GCaMP3; red: autofluorescence; blue: second-harmonic generation from dermal collagen. (b) Heat map showing the relative intensity of the fluorescence of GCaMP3 in each granular cell. Note that each cell exhibits a transient elevation of fluorescence only once in the observation period. (c) Duration of transient [Ca2+]i elevation in the granular cells in ear skin (n = 10 cells) and fingertip skin (n = 17 cells). (d) Percentage of area with elevated fluorescence of GCaMP3 in an observation field in the ear and fingertip skin. Overall, 13 and 25 time points were analyzed in the ear and fingertip skin, respectively. (e) Representative two-photon image of the fingertip skin of mice systemically expressing GCaMP3 and tandem dimer Tomato (GCaMP3/tdTomato mice). Arrow: intra-epidermal sweat duct. Green: GCaMP3, red: tdTomato. (f) Time-projection image showing the order of transient [Ca2+]i elevation in the fingertip skin. Bright green: newly appearing cells with transient [Ca2+]i elevation; dark green: areas that showed transient [Ca2+]i elevation previously; magenta: area that showed overlap of transient [Ca2+]i elevation. Error bars: standard error of the mean. Scale bars: 50 μm. Results are representative of at least three independent experiments.

