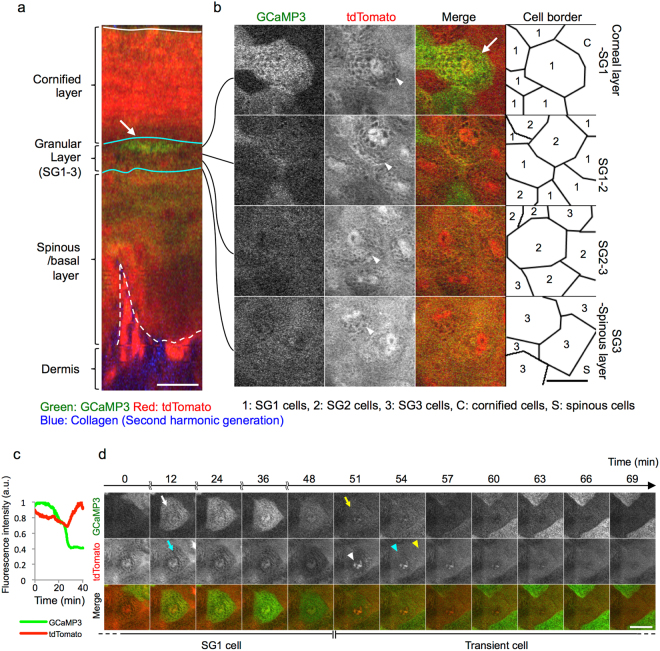
Figure 5.
Temporal relationship between transient [Ca2+]i elevation and cornification. (a,b) Representative images of two-photon microscope of the fingertip skin of GCaMP3/tdTomato mice. (a) Vertical view. Note that cornified cells exhibit intensified fluorescence of tdTomato. Arrows: granular cells with transient [Ca2+]i elevation. White line: the surface of the skin. Cyan lines: upper and lower borders of the granular layer. Dashed white line: dermo-epidermal junction. (b) Horizontal view showing the granular layer at different depths. Note that nuclei and cytoplasmic granules are visualized with the fluorescence of tdTomato. (c) Representative plot of the relative fluorescence intensity of GCaMP3 (green line) and tdTomato (red line) in the process of transient [Ca2+]i elevation and cornification. (d) Time-lapse imaging of the most apical granular cell. A white arrow indicates the start of [Ca2+]i elevation, and a yellow arrow indicates the end of [Ca2+]i elevation. Cyan arrow: cytoplasmic granules. White arrowhead: abrupt elevation of the fluorescence of tdTomato in the nucleus. Cyan arrowhead: disappearance of cytoplasmic granules. Yellow arrowhead: cornified cell that becomes indistinguishable from the neighboring cell. Green: GCaMP3, red: tdTomato, blue: second-harmonic generation from dermal collagen. Scale bars: 20 μm. Results are representative of at least three independent experiments.

