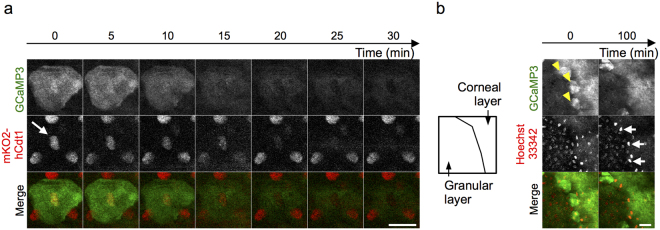
Figure 6.
Temporal relationship between the transient [Ca2+]i elevation and changes in the nucleus. (a) Time-lapse imaging of the most apical granular cell in the hind paw of mice systemically expressing Fucci and GCaMP3. Arrow: nuclear signal of red fluorescent protein of Fucci system. Note that the nuclear signal disappeared along with the decrease in the fluorescence of GCaMP3. (b) Time-lapse imaging of the granular and cornified layers of the hind paw skin of GCaMP3 mice injected with Hoechst 33342. Yellow arrowheads: granular cells with elevated fluorescence of GCaMP3. White arrows: intensified fluorescence of Hoechst 33342. Green: GCaMP3; red: mKO2-hCdt1 (a), Hoechst 33342 (b). Scale bars: 20 μm. Results are representative of at least two independent experiments.

