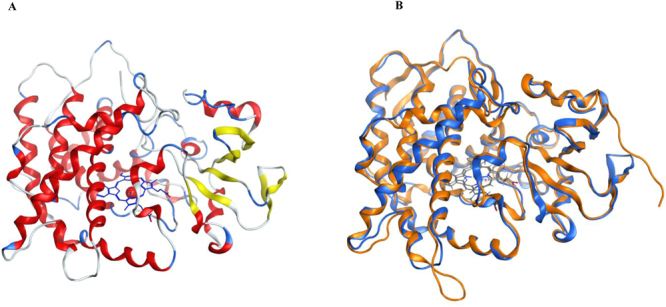
Figure 4.

In silico structural analysis of CYP5619A1. (A) 3D model of CYP5619A1 with heme cofactor. Secondary structures are displayed in red (helices), yellow (sheets) and blue (coils and turns). (B) Comparative structural analysis of CYP5619A1 model with CYP120A1. Superimposed image of CYP5619A1 model (blue) with CYP102A1 crystal structure (orange) is shown in the Figure. The CYP5619A1 structure is shown in blue and the template CYP120A1 structure is shown in orange.
