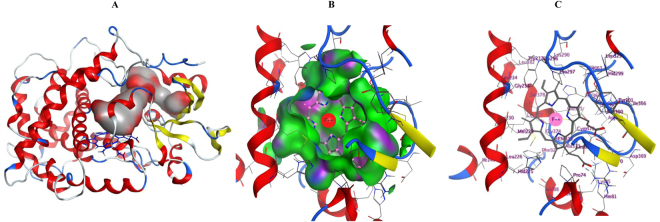
Figure 5.
Active site analysis of CYP5619A1. (A) Active site cavity of CYP5619A1. The active site cavity is shown with the substrate access channel in grey (hydrophobic site) and red (hydrophilic site) surface. (B & C) Active site view of the binding pocket of CYP5619A1. (B) The pocket is displayed with MOE ActiveLP color coding (Blue: Mild polar; Green: Hydrophobic; Pink: H-Bonding) and shows a pattern of high hydrophobicity. (C) Residues forming the pocket are labelled. The amino acids lining the active site cavity are shown in Table S5. Secondary structures are displayed in red (helices), yellow (sheets) and blue (coils and turns). The heme prosthetic group appearing at the center of the active site is shown along with iron atom in a ball shape.

