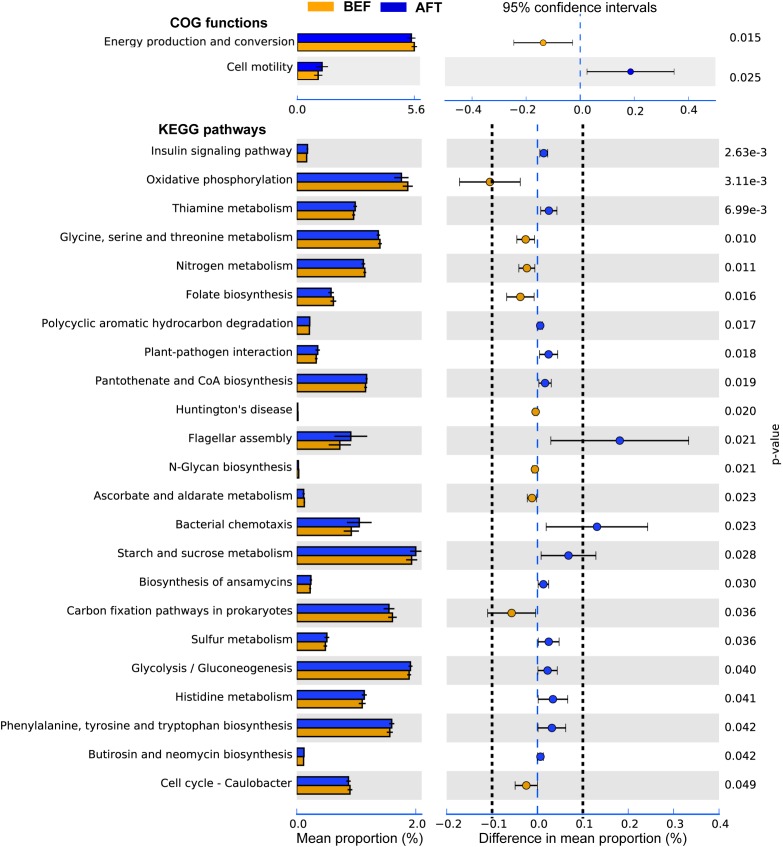
FIGURE 3.
Extended error bar plot indicating the functional differences of GM in runners before and after running. COG and KEGG categories were obtained from 16s rRNA gene sequences using PICRUSt. Significant differences between two groups were tested with Welch’s t-test (p-value < 0.05). The KEGG pathways with the difference in mean proportion effect size > 0.1% were separated by dotted lines.

