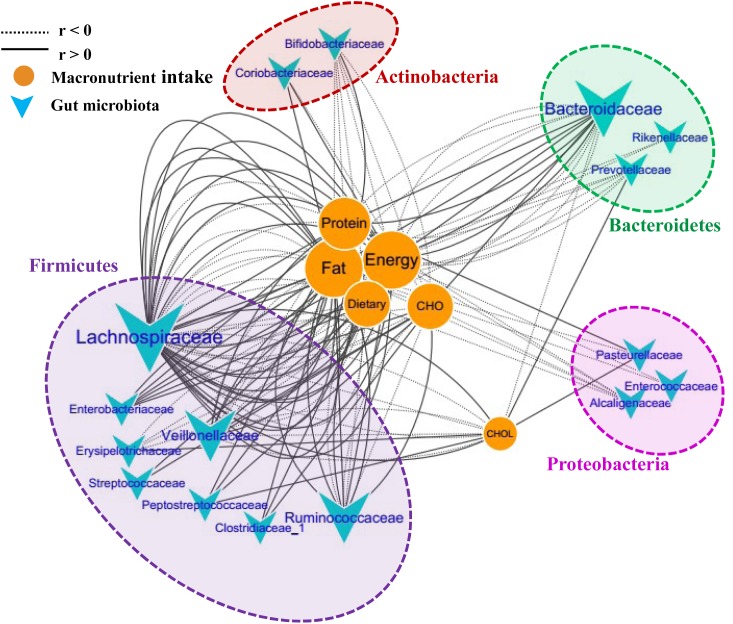
FIGURE 5.
Correlation network of the GM and macronutrient intake. The network consists of 135 edges (significant correlations with p < 0.05) and 22 nodes (bacterial taxa and macronutrient). The bacterial taxa nodes are clustered in four subnetworks (phylum taxa). A solid line shows positive correlations; a dotted line shows negative correlations, and a wider line shows the larger correlation (absolute values of r). CHO, carbohydrate; CHOL, cholesterol.

