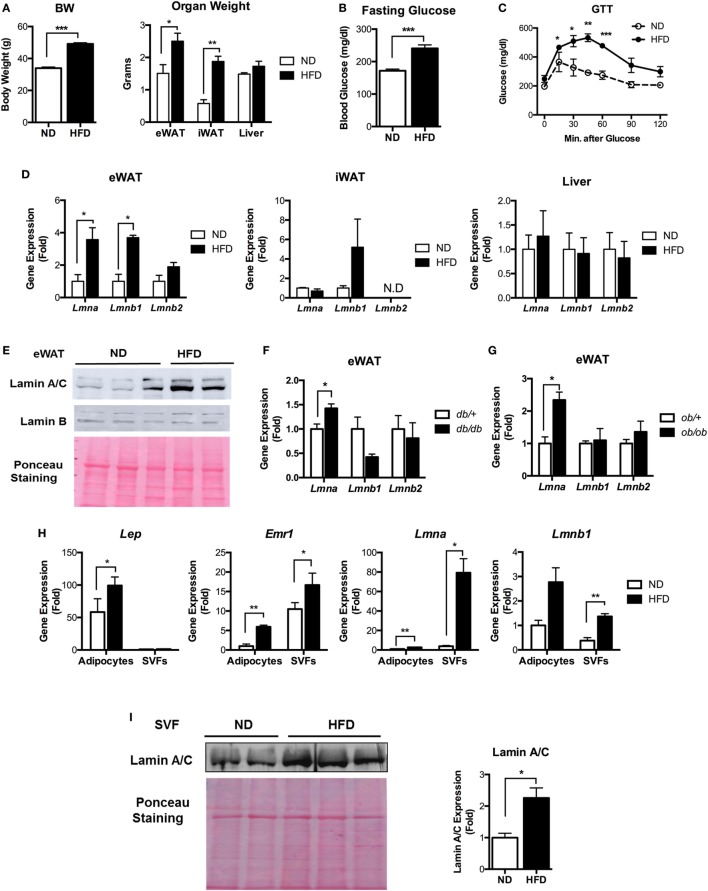
Figure 1.
Lamin A/C expression is upregulated in adipose tissue from obese mice. (A–E) Male C57BL/6 mice were fed a normal chow diet (ND) or a high-fat diet (HFD) for 12 weeks to induce obesity (n = 14 per group). (A) Total body weights (left) and organ weights (right), (B) fasting blood glucose, (C) glucose tolerance test, and (D) quantitative real-time RT-PCR (qRT-PCR) analysis of Lmna, Lmnb1, and Lmnb2 in eWAT, iWAT, and liver from ND- and HFD-fed mice. Amounts of transcripts for each gene in HFD tissues relative to those in ND tissues are presented. (E) Western blotting analysis of epididymal white adipose tissues (eWAT) lysate from ND- and HFD-fed mice. Lamin A/C (upper), lamin B1 (middle) protein levels are presented. Equal amount of total proteins as measured by Ponceau S staining (lower) of each lane. (F) qRT-PCR analysis of Lmna, Lmnb1, and Lmnb2 in eWAT from db/+ and db/db male mice (8 weeks, n = 5 per group). (G) qRT-PCR analysis of Lmna, Lmnb1, and Lmnb2 in eWAT from ob/+ and ob/ob male mice (10 weeks, n = 4 per group). (H) qRT-PCR analysis of Lep, Emr1, Lmna, and Lmnb1 in adipocyte fractions and stromal vascular cell fractions from eWAT of ND and HFD mice (n = 6 per group). (I) Immunoblots of lysates from the stromal vascular fraction (SVF) of eWAT from ND and HFD mice for lamin A/C antibody (upper left), Ponceau S staining (lower left) and quantitation of lamin A/C (right) were presented. Error bars represent SEM. *p < 0.05, **p < 0.01, ***p < 0.001.

