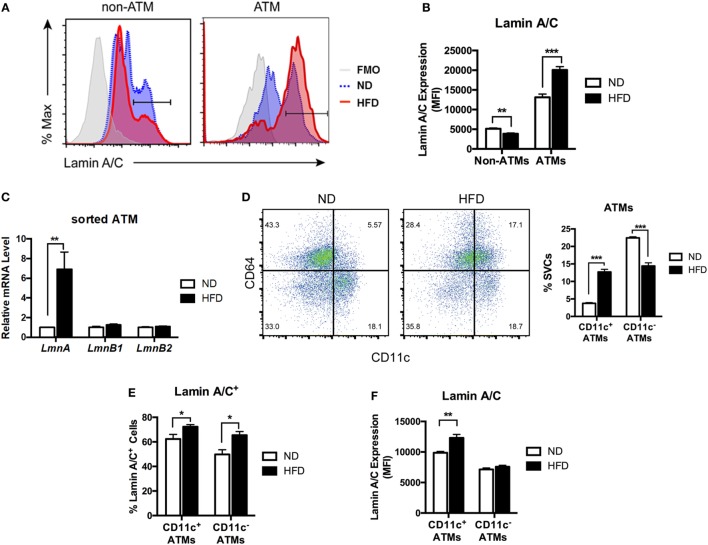
Figure 2.
Lamin A/C expression is elevated in adipose tissue macrophages (ATMs) from obese mice. Male C57BL/6 mice were fed a normal diet (ND) or a high-fat diet (HFD) for 12 weeks (n = 6 per group). (A) Histogram of lamin A/C in non-ATM (CD45+CD64−) and ATM (CD45+CD64+) from ND- and HFD-fed mice. (B) Lamin A/C expression level as determined by mean fluorescence intensity (MFI) in the non-ATM and ATM populations from epididymal white adipose tissues (eWAT) of ND and HFD mice (n = 5 per group). (C) Quantitative real-time RT-PCR analysis of Lmna, Lmnb1, and Lmnb2 in sorted ATMs from eWAT of ND- and HFD-fed mice (n = 3 per groups). (D) A representative flow cytometry plot showing ATMs (CD64+CD11c− and CD64+CD11c+) and ATDCs (CD64−CD11c+) in stromal vascular cell (left) and frequency of CD11c+ ATMs and CD11c− ATMs from eWAT of ND- and HFD-fed mice (right). (E) The frequency of lamin A/C+ cells in the CD11c+ and CD11c− ATM populations in eWAT from ND and HFD mice. (F) Lamin A/C expression level as determined by MFI in the CD11c+ and CD11c− ATM populations from eWAT of ND and HFD mice. Error bars represent SEM. *p < 0.05, **p < 0.01, ***p < 0.001.

