
Figure 2.
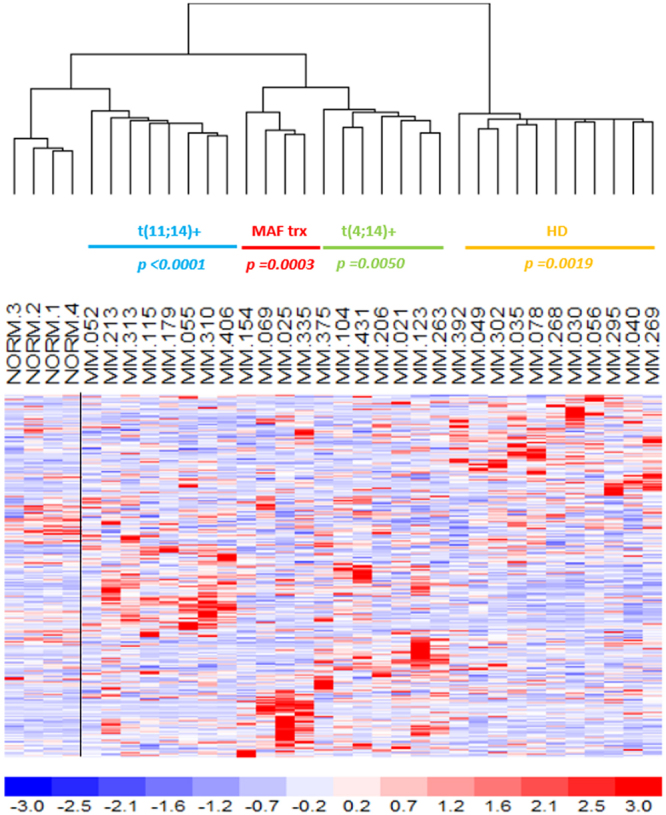
LncRNAs expression validation by microarray analysis. Hierarchical clustering (Pearson’s correlation and centroid as distance and linkage methods) of the 30 samples and 4 normal controls profiled on GeneChip® Human Gene 2.0ST arrays according to the expression values of the 262-lncRNA list. Under each branch, hyperdiploid status (HD), t(11;14), t(4;14) or MAF translocation (MAF trx) are specified with the corresponding p-values.