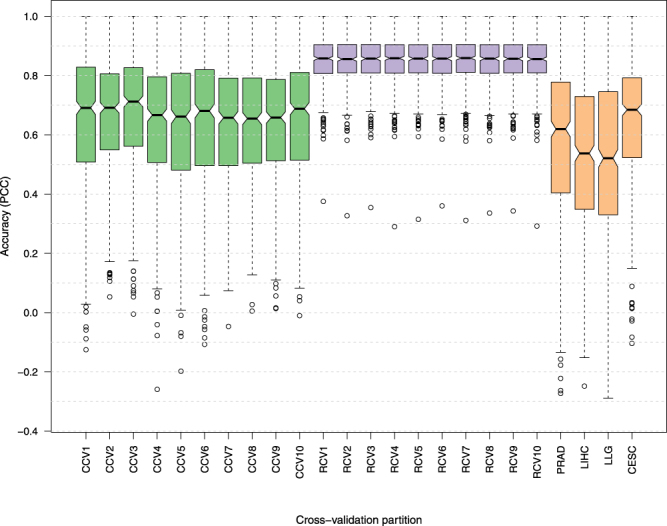
Figure 3.

Cross-validation performance of the LARS regression model for gene expression prediction. Distribution of the Pearson correlation coefficients between predictions and real gene expression values over all test conditions. Each box plot shows the correlation calculated for 500 different genes. The ten boxplots labeled as CCV/RCV represent ten different clustering-based/Random 6-fold CV partition collections. Boxplots labeled as PRAD, LIHC, LLG, and CESC represent the performance of the regression method on conditions associated with cancer types not present in cross-validation studies. A higher Pearson correlation indicates higher accuracy.
